ScatterPlot2D.marker_style#
- property ScatterPlot2D.marker_style[source]#
Return or set the plot’s marker style.
Examples
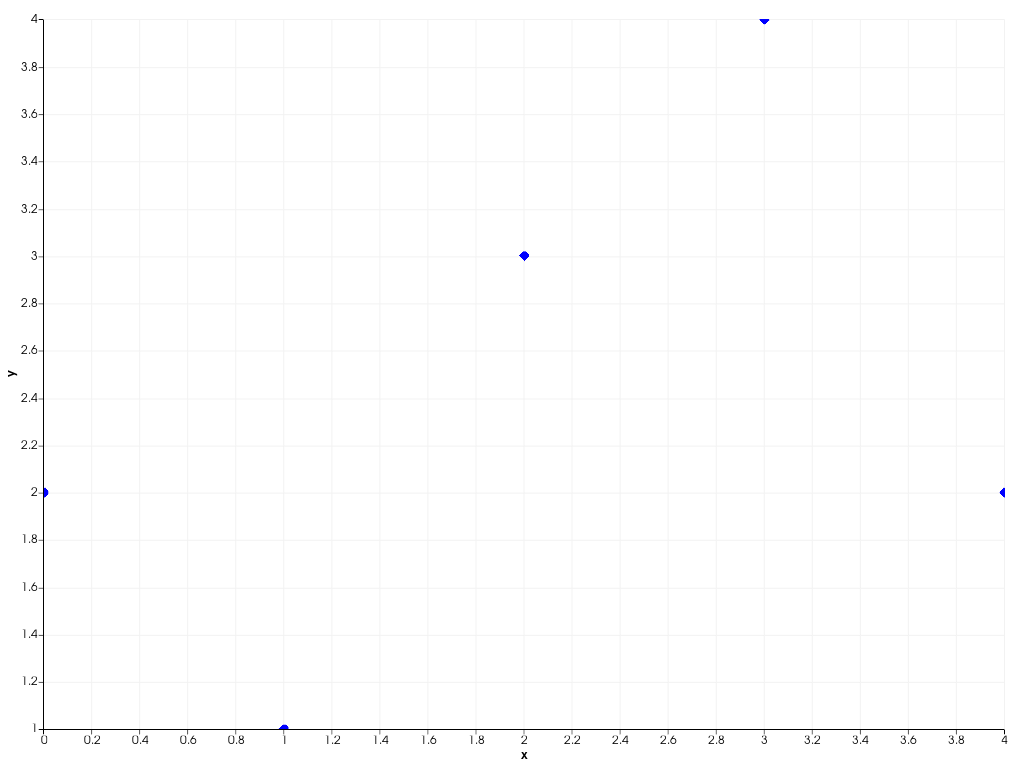
Create a 2D scatter plot.
>>> import pyvista as pv
>>> chart = pv.Chart2D()
>>> plot = chart.scatter([0, 1, 2, 3, 4], [2, 1, 3, 4, 2])
>>> chart.show()
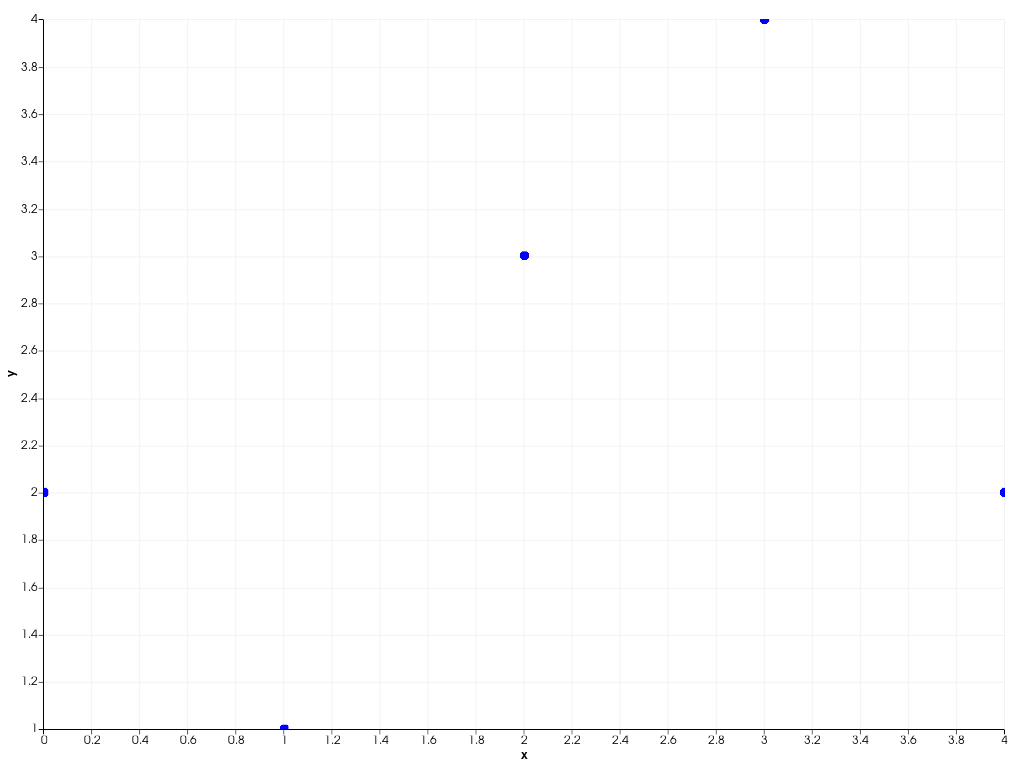
Change the marker style.
>>> plot.marker_style = 'd'
>>> chart.show()