Note
Go to the end to download the full example code.
Load data using a Reader#
To have more control over reading data files, use a class based reader.
This class allows for more fine-grained control over reading datasets from
files. See pyvista.get_reader() for a list of file types supported.
from tempfile import NamedTemporaryFile

import numpy as np
import pyvista as pv
from pyvista import examples
An XML PolyData file in .vtp format is created. It will be saved in a
temporary file for this example.
temp_file = NamedTemporaryFile('w', suffix='.vtp')
temp_file.name
'/tmp/tmpmd2rgff3.vtp'
pyvista.Sphere already includes Normals point data. Additionally
height point data and id cell data is added.
mesh = pv.Sphere()
mesh['height'] = mesh.points[:, 1]
mesh['id'] = np.arange(mesh.n_cells)
mesh.save(temp_file.name)
pyvista.read() function reads all the data in the file. This provides
a quick and easy one-liner to read data from files.
new_mesh = pv.read(temp_file.name)
print(f'All arrays: {mesh.array_names}')
All arrays: ['height', 'Normals', 'id']
Using pyvista.get_reader() enables more fine-grained control of reading data
files. Reading in a .vtp` file uses the pyvista.XMLPolyDataReader.
reader = pv.get_reader(temp_file.name)
reader
# Alternative method: reader = pyvista.XMLPolyDataReader(temp_file.name)
XMLPolyDataReader('/tmp/tmpmd2rgff3.vtp')
Some reader classes, including this one, offer the ability to inspect the data file before loading all the data. For example, we can access the number and names of point and cell arrays.
print(f'Number of point arrays: {reader.number_point_arrays}')
print(f'Available point data:   {reader.point_array_names}')
print(f'Number of cell arrays:  {reader.number_cell_arrays}')
print(f'Available cell data:    {reader.cell_array_names}')
Number of point arrays: 2
Available point data:   ['Normals', 'height']
Number of cell arrays:  1
Available cell data:    ['id']
We can select which data to read by selectively disabling or enabling
specific arrays or all arrays. Here we disable all the cell arrays and
the Normals point array to leave only the height point array. The data
is finally read into a pyvista object that only has the height point array.
reader.disable_all_cell_arrays()
reader.disable_point_array('Normals')
print(f'Point array status: {reader.all_point_arrays_status}')
print(f'Cell array status:  {reader.all_cell_arrays_status}')
reader_mesh = reader.read()
print(f'Read arrays:        {reader_mesh.array_names}')
Point array status: {'Normals': False, 'height': True}
Cell array status:  {'id': False}
Read arrays:        ['height']
We can reuse the reader object to choose different variables if needed.
reader.enable_all_cell_arrays()
reader_mesh_2 = reader.read()
print(f'New read arrays: {reader_mesh_2.array_names}')
New read arrays: ['height', 'id']
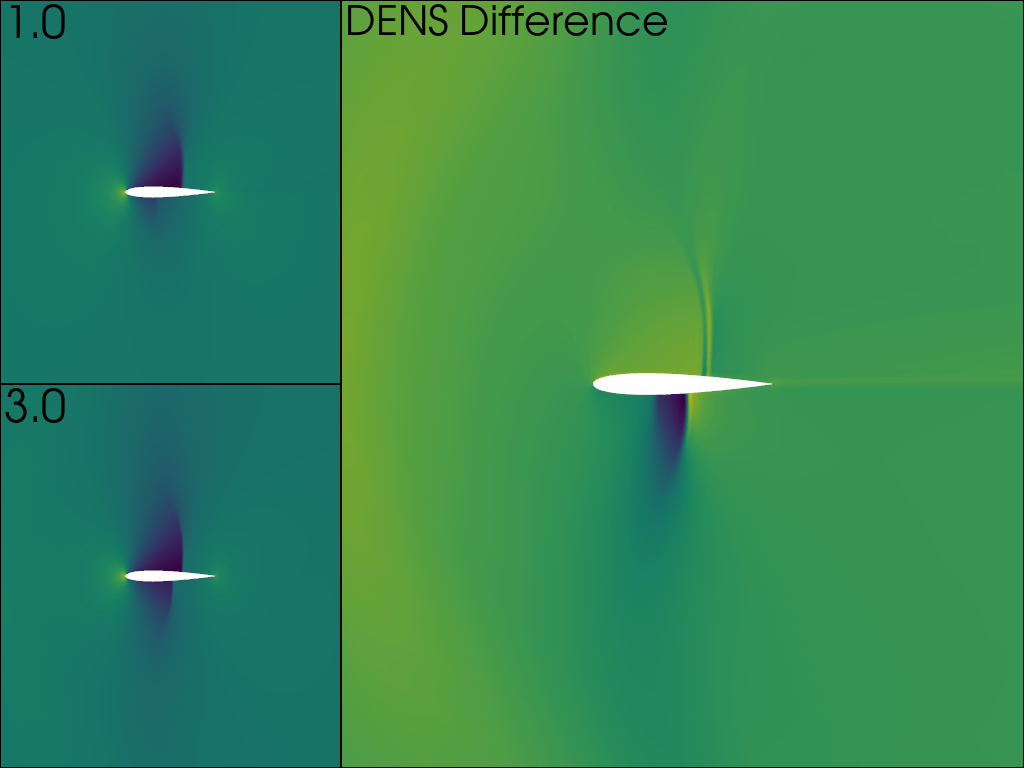
Some Readers support setting different time points or iterations. In both
cases, this is done using the time point functionality. The NACA
dataset has two such points with density. This dataset is in EnSight format,
which uses the pyvista.EnSightReader class.
filename = examples.download_naca(load=False)
reader = pv.get_reader(filename)
time_values = reader.time_values
print(reader)
print(f'Available time points: {time_values}')
print(f'Available point arrays: {reader.point_array_names}')
EnSightReader('/home/runner/.cache/pyvista_3/EnSight/naca.bin.case')
Available time points: [1.0, 3.0]
Available point arrays: ['DENS']
First both time points are read in, and then the difference in density is
calculated and saved on the second mesh. The read method of
pyvista.EnSightReader returns a pyvista.MultiBlock instance.
In this dataset, there are 3 blocks and the new scalar must be applied on each
block.
reader.set_active_time_value(time_values[0])
mesh_0 = reader.read()
reader.set_active_time_value(time_values[1])
mesh_1 = reader.read()

for block_0, block_1 in zip(mesh_0, mesh_1, strict=True):
    block_1['DENS_DIFF'] = block_1['DENS'] - block_0['DENS']
The value of DENS is plotted on the left column for both time points, and the difference on the right.
pl = pv.Plotter(shape='2|1')

pl.subplot(0)
pl.add_mesh(mesh_0, scalars='DENS', show_scalar_bar=False)
pl.add_text(f'{time_values[0]}')

pl.subplot(1)
pl.add_mesh(mesh_1, scalars='DENS', show_scalar_bar=False)
pl.add_text(f'{time_values[1]}')

# pyvista currently cannot plot the same mesh twice with different scalars
pl.subplot(2)
pl.add_mesh(mesh_1.copy(), scalars='DENS_DIFF', show_scalar_bar=False)
pl.add_text('DENS Difference')

pl.link_views()
pl.camera_position = pv.CameraPosition(
    position=(0.5, 0, 8), focal_point=(0.5, 0, 0), viewup=(0, 1, 0)
)

pl.show()
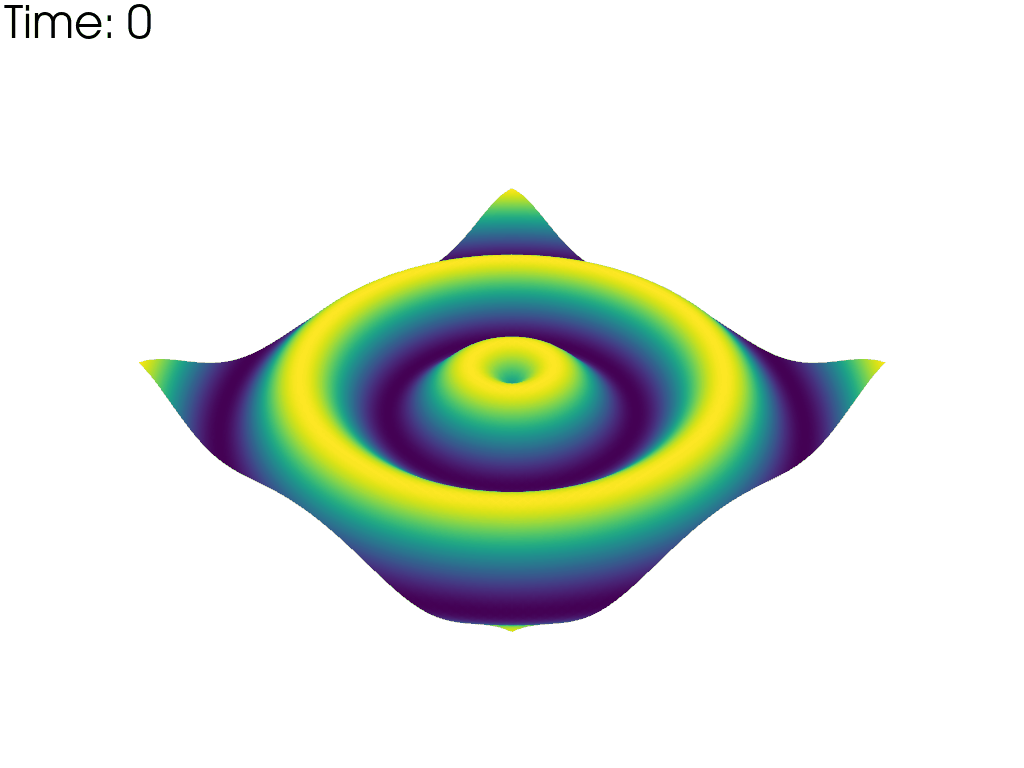
Reading time points or iterations can also be utilized to make a movie.
Compare to Create a GIF Movie, but here a set of files are read in
through a ParaView Data format file. This file format and reader also return a
pyvista.MultiBlock mesh.
filename = examples.download_wavy(load=False)
reader = pv.get_reader(filename)
print(reader)
PVDReader('/home/runner/.cache/pyvista_3/PVD/wavy.zip.unzip/wavy.pvd')
For each time point, plot the mesh colored by the height. Put iteration value in top left
pl = pv.Plotter(notebook=False, off_screen=True)
# Open a gif
pl.open_gif('wave_pvd.gif')

for time_value in reader.time_values:
    reader.set_active_time_value(time_value)
    mesh = reader.read()[0]  # This dataset only has 1 block
    pl.add_mesh(mesh, scalars='z', show_scalar_bar=False, lighting=False)
    pl.add_text(f'Time: {time_value:.0f}', color='black')
    pl.write_frame()
    pl.clear()

pl.close()
Total running time of the script: (0 minutes 2.237 seconds)
