plot_cell#
- plot_cell(
- grid: DataSet | MultiBlock,
- cpos: CameraPositionOptions | None = None,
- *,
- line_width: int | None = None,
- point_size: int | None = None,
- font_size: int | None = None,
- show_normals: bool = False,
- normals_scale: float | None = None,
- **kwargs,
Plot a mesh while displaying cell indices.
Changed in version 0.45: The default line width, point size, and font size are increased from
5,30and20to10,80, and50, respectively.Changed in version 0.47: The default line width, point size, and font size are restored to their original values prior to version 0.45. These values can now be customized with keywords.
- Parameters:
- grid
pyvista.DataSet|pyvista.MultiBlock Dataset containing one single cell (ideally), though plotting a mesh with multiple cells is supported.
Changed in version 0.47: Plotting
PolyDatais now supported.Changed in version 0.48: Plotting
MultiBlockis now supported.- cpos
str,optional Camera position.
- line_width
int, default: 5 Line width of the cell’s edges.
Added in version 0.47.
- point_size
int, default: 30 Size of the cell’s points.
Added in version 0.47.
- font_size
int, default: 20 Size of the point labels.
Added in version 0.47.
- show_normalsbool,
optional Show the face normals of the cell. Only applies to 2D or 3D cells. Cell faces with correct orientation should have the normal pointing outward.
The size of the normals is controlled by
normals_scale.Added in version 0.47.
- normals_scale
float, default: 0.1 Scale factor used when
show_normalsis enabled. The normals are scaled proportional to the diagonal length of the inputgrid.Added in version 0.47.
- **kwargs
dict,optional Additional keyword arguments when showing. See
pyvista.Plotter.show().
- grid
Examples
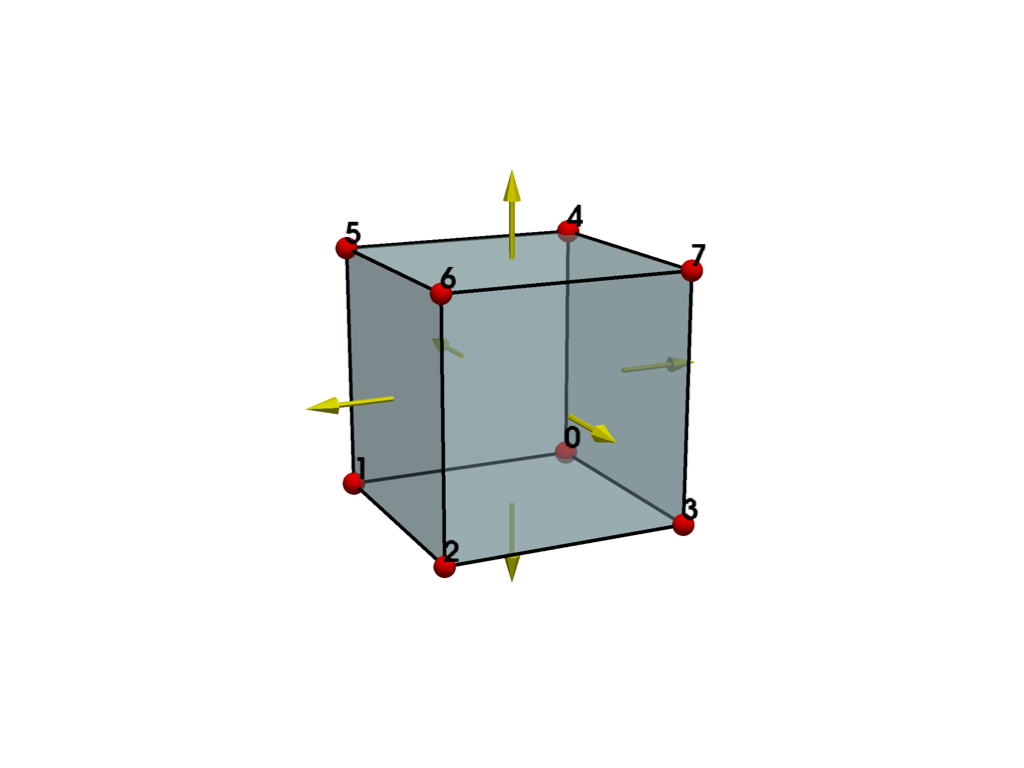
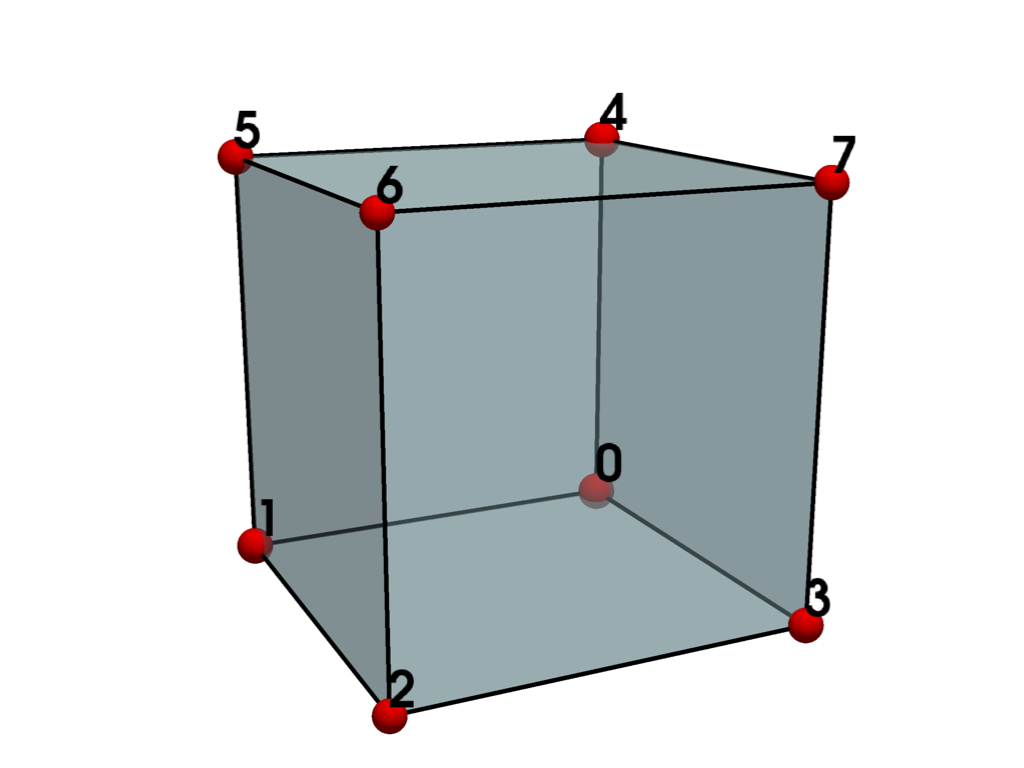
Create and plot a single hexahedron.
>>> from pyvista import examples
>>> grid = examples.cells.Hexahedron()
>>> examples.plot_cell(grid)
Show normals and customize the size of various elements in the rendering.
>>> examples.plot_cell(
...     grid,
...     show_normals=True,
...     normals_scale=0.2,
...     line_width=8,
...     point_size=50,
...     font_size=30,
... )