Note
Go to the end to download the full example code.
Extrude Rotation#
Sweep polygonal data creating “skirt” from free edges and lines, and
lines from vertices using the extrude_rotate()
filter.
This takes polygonal data as input and generates polygonal data on output. The input dataset is swept around the z-axis to create new polygonal primitives. These primitives form a “skirt” or swept surface. For example, sweeping a line results in a cylindrical shell, and sweeping a circle creates a torus.
import numpy as np
import pyvista as pv
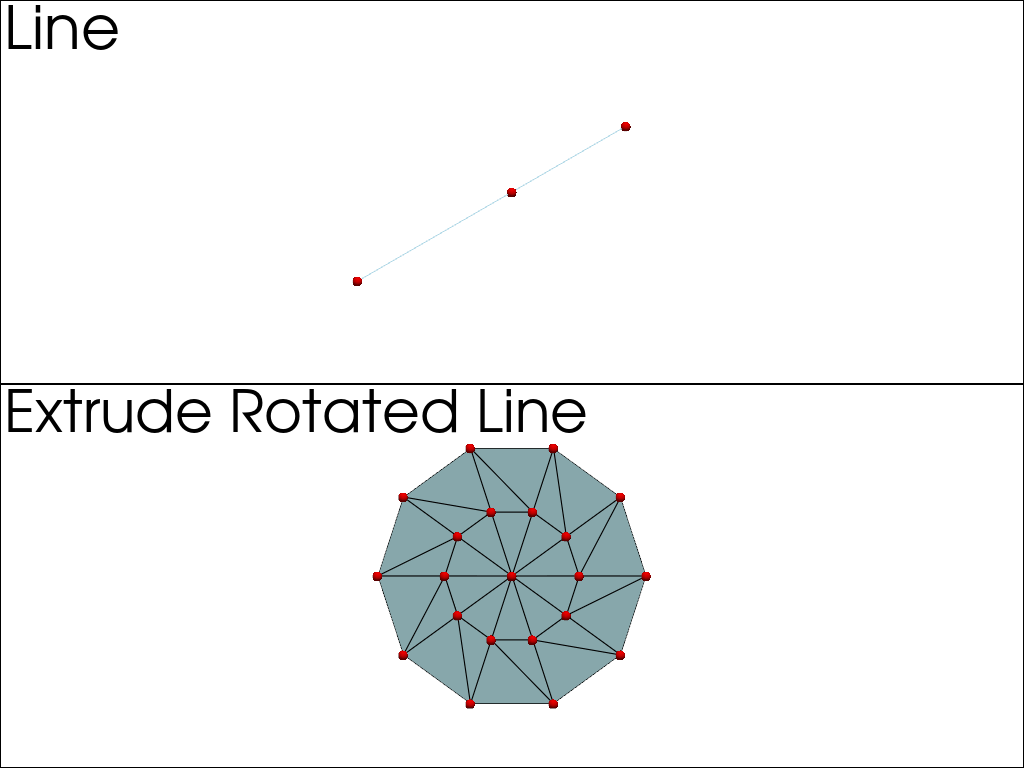
# create a line and rotate it about the Z-axis
resolution = 10
line = pv.Line(pointa=(0, 0, 0), pointb=(1, 0, 0), resolution=2)
poly = line.extrude_rotate(resolution=resolution, capping=False)
poly
Plot the extruded line#
pl = pv.Plotter(shape=(2, 1))
pl.subplot(0, 0)
pl.add_text('Line', font_size=24)
pl.add_mesh(line, color='lightblue', show_edges=True)
pl.add_mesh(
    pv.PolyData(line.points),
    color='red',
    point_size=10,
    render_points_as_spheres=True,
)
pl.subplot(1, 0)
pl.add_text('Extrude Rotated Line', font_size=24)
pl.add_mesh(poly, color='lightblue', show_edges=True)
pl.add_mesh(
    pv.PolyData(poly.points),
    color='red',
    point_size=10,
    render_points_as_spheres=True,
)

pl.show(cpos='xy')
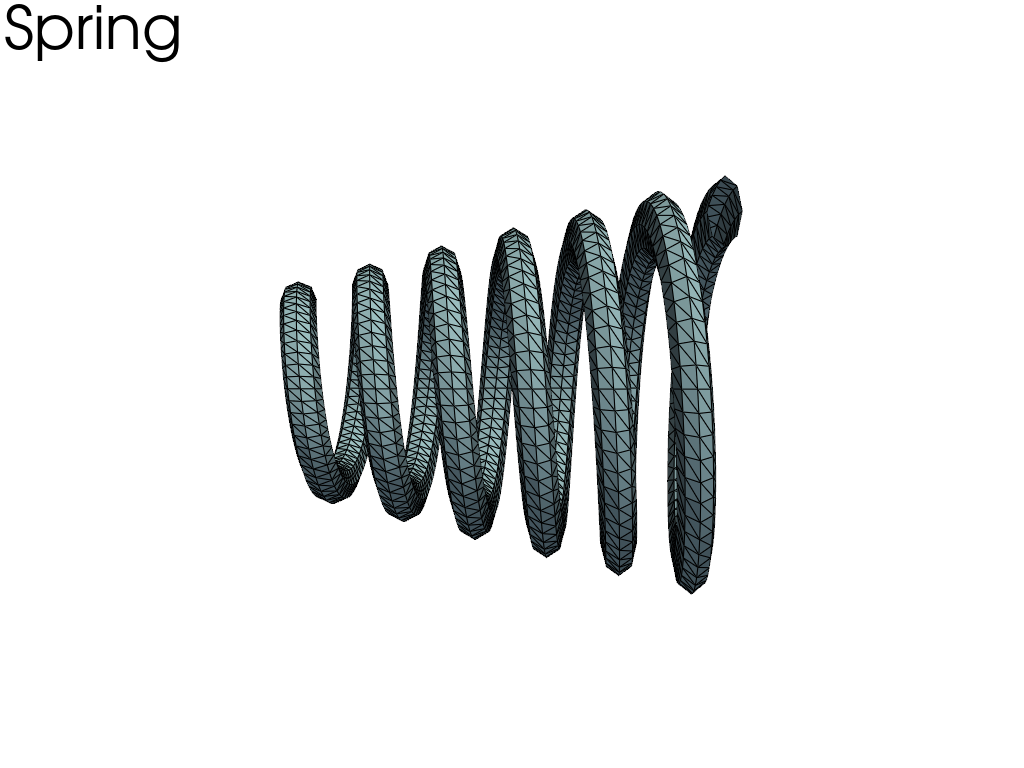
Create a spring#
# Create the spring profile (a circle).
pl = pv.Plotter()

vertices = np.array(
    [
        [1.0, 0.0, 0.0],
        [1.0732, 0.0, -0.1768],
        [1.25, 0.0, -0.25],
        [1.4268, 0.0, -0.1768],
        [1.5, 0.0, 0.00],
        [1.4268, 0.0, 0.1768],
        [1.25, 0.0, 0.25],
        [1.0732, 0.0, 0.1768],
    ],
)
faces = np.hstack([[8, 0, 1, 2, 3, 4, 5, 6, 7]])
profile = pv.PolyData(vertices, faces)

# Extrude the profile to make a spring.
spring = profile.extrude_rotate(
    resolution=360, translation=6.0, dradius=1.0, angle=2160.0, capping=False
)
pl.add_text('Spring', font_size=24)
pl.add_mesh(spring, color='lightblue', show_edges=True)

pl.show(cpos='zx')
Total running time of the script: (0 minutes 0.550 seconds)
