Note
Go to the end to download the full example code.
Plotting with VTK Algorithms#
Pass a vtkAlgorithm to the Plotter for dynamic visualizations.
Note
By “dynamic visualization” we mean that as the input data/source changes, so will the visualization in real time.
A vtkAlgorithm is the superclass for all sources, filters, and sinks in VTK. It defines a generalized interface for executing data processing algorithms. Pipeline connections are associated with input and output ports that are independent of the type of data passing through the connections.
We can connect the output port of a vtkAlgorithm to PyVista’s rendering
pipeline when adding data to the scene through methods like
add_mesh().
This example will walk through using a few vtkAlgorithm filters directly and passing them to PyVista for dynamic visualization.
import pyvista as pv
from pyvista import examples
import vtk
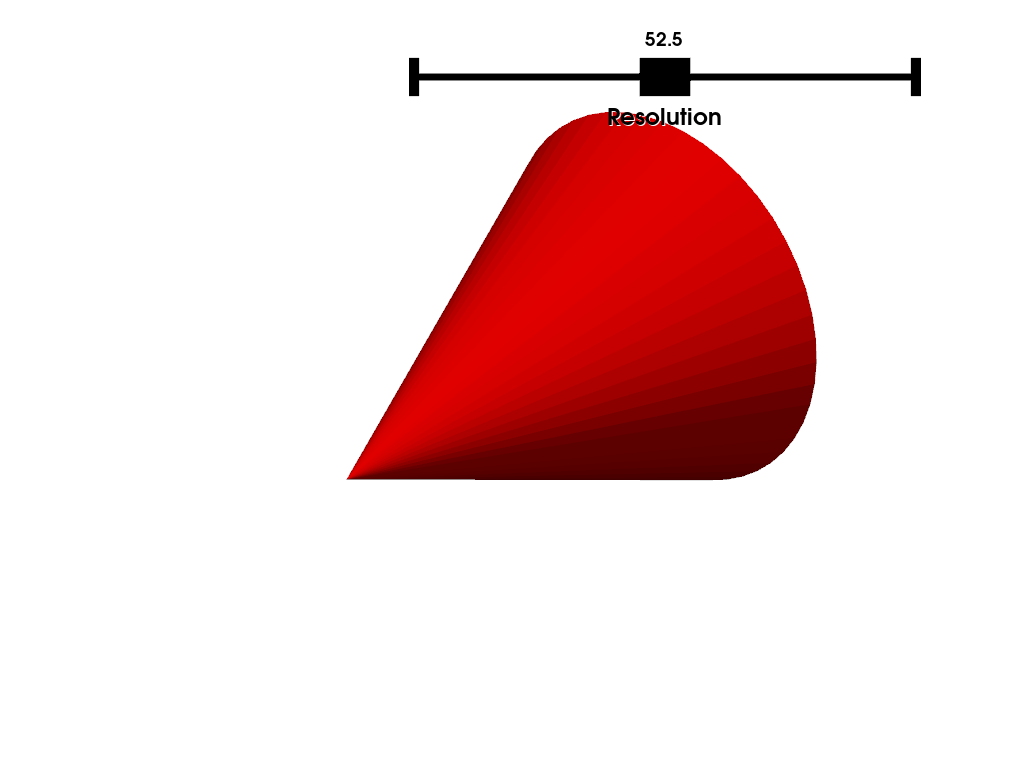
Use vtkConeSource as a source algorithm. This source will dynamically create a cone object depending on the instances’s parameters. In this example, we will connect a callback to set the cone source algorithm’s resolution via vtkConeSource.SetResolution.
algo = pv.ConeSource()


def update_resolution(value):
    """Set the resolution of the cone generator."""
    res = round(value)
    algo.resolution = res
Pass the vtkConeSource (a vtkAlgorithm subclass) directly to the plotter and connect a slider widget to our callback that adjusts the resolution.
pl = pv.Plotter()
pl.add_mesh(algo, color='red')
pl.add_slider_widget(update_resolution, [5, 100], title='Resolution')
pl.show()
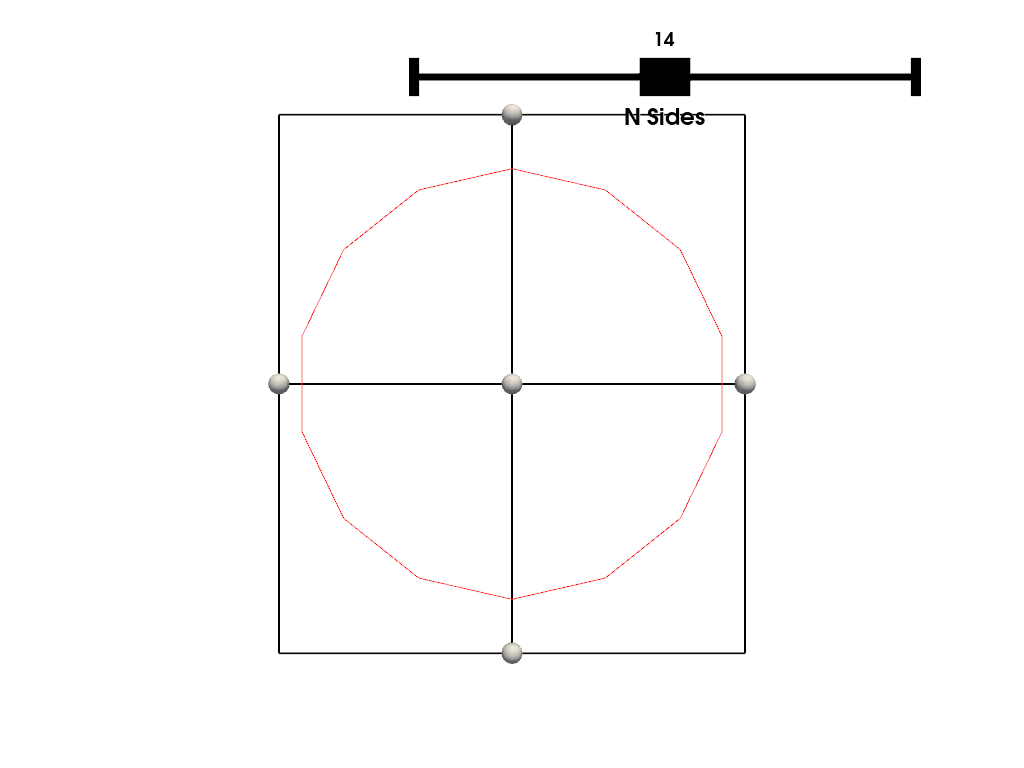
Here is another example using vtkRegularPolygonSource.
poly_source = vtk.vtkRegularPolygonSource()
poly_source.GeneratePolygonOff()
poly_source.SetRadius(5.0)
poly_source.SetCenter(0.0, 0.0, 0.0)


def update_n_sides(value):
    """Set the number of sides."""
    res = round(value)
    poly_source.SetNumberOfSides(res)


pl = pv.Plotter()
pl.add_mesh_clip_box(poly_source, color='red')
pl.add_slider_widget(update_n_sides, [3, 25], title='N Sides')
pl.view_xy()
pl.show()
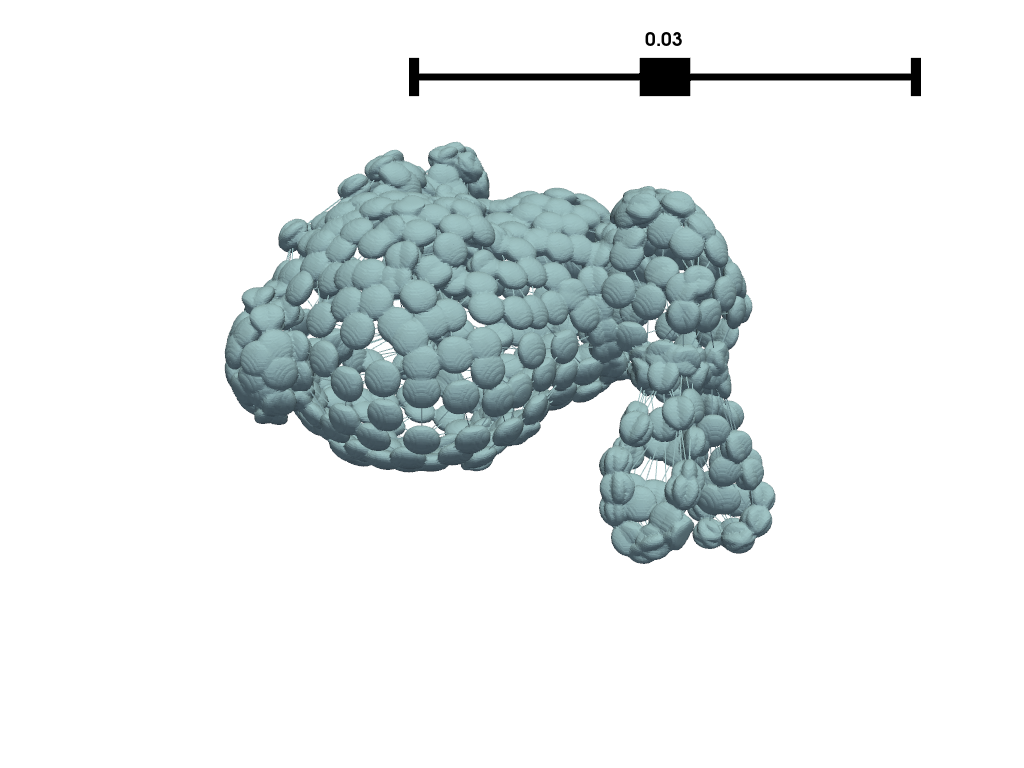
Filter Pipeline#
We can do this with any vtkAlgorithm subclass for dynamically generating or filtering data. Here is an example of executing a pipeline of VTK filters together.
# Source mesh object (static)
mesh = examples.download_bunny_coarse()

# Initialize VTK algorithm to modify dynamically
splatter = vtk.vtkGaussianSplatter()

# Pass PyVista object as input to VTK
splatter.SetInputData(mesh)

# Set parameters of splatter filter
n = 200
splatter.SetSampleDimensions(n, n, n)
splatter.SetRadius(0.02)
splatter.SetExponentFactor(-10)
splatter.SetEccentricity(2)
splatter.Update()

# Pipe splatter filter into a contour filter
contour = vtk.vtkContourFilter()
contour.SetInputConnection(splatter.GetOutputPort())
contour.SetInputArrayToProcess(0, 0, 0, 0, 'SplatterValues')
contour.SetNumberOfContours(1)
contour.SetValue(0, 0.95 * splatter.GetRadius())

# Use PyVista to plot output of contour filter
pl = pv.Plotter(notebook=0)
pl.add_mesh(mesh, style='wireframe')
pl.add_mesh(contour, color=True)
pl.add_slider_widget(splatter.SetRadius, [0.01, 0.05])
pl.show()
Total running time of the script: (0 minutes 4.692 seconds)
