Note
Go to the end to download the full example code.
Marching Cubes#
Generate a surface from a scalar field using the flying edges and
marching cubes filters as provided by the contour filter.
Special thanks to GitHub user stla for providing examples.
from __future__ import annotations

import numpy as np

import pyvista as pv
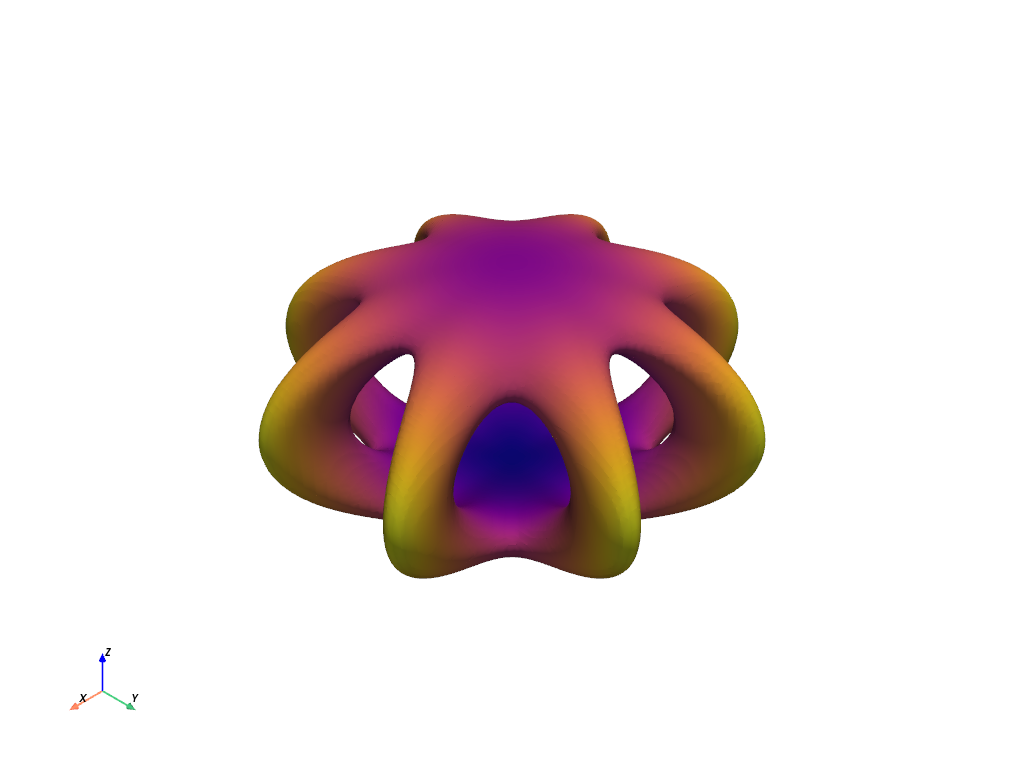
Spider Cage#
Use the marching cubes algorithm to extract the isosurface generated from the spider cage function.
a = 0.9


def spider_cage(x, y, z):
    x2 = x * x
    y2 = y * y
    x2_y2 = x2 + y2
    return (np.sqrt((x2 - y2) ** 2 / x2_y2 + 3 * (z * np.sin(a)) ** 2) - 3) ** 2 + 6 * (
        np.sqrt((x * y) ** 2 / x2_y2 + (z * np.cos(a)) ** 2) - 1.5
    ) ** 2


# create a uniform grid to sample the function with
n = 100
x_min, y_min, z_min = -5, -5, -3
grid = pv.ImageData(
    dimensions=(n, n, n),
    spacing=(abs(x_min) / n * 2, abs(y_min) / n * 2, abs(z_min) / n * 2),
    origin=(x_min, y_min, z_min),
)
x, y, z = grid.points.T

# sample and plot
values = spider_cage(x, y, z)
mesh = grid.contour([1], values, method='marching_cubes')
dist = np.linalg.norm(mesh.points, axis=1)
mesh.plot(scalars=dist, smooth_shading=True, cmap='plasma', show_scalar_bar=False)

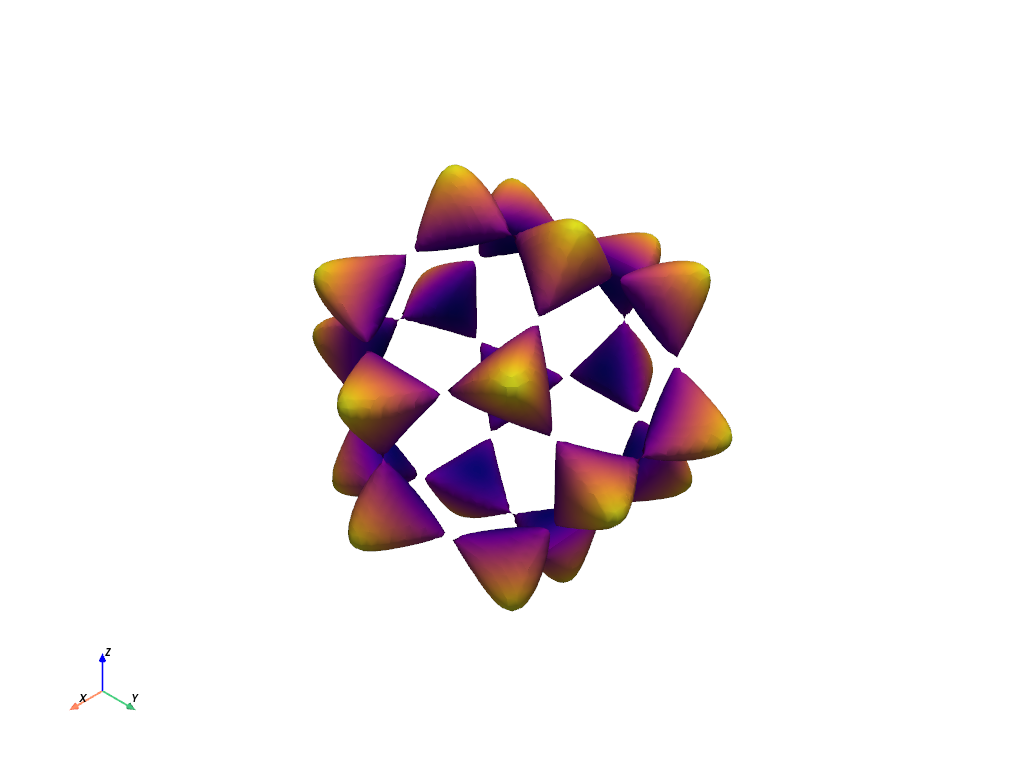
Barth Sextic#
Use the flying edges algorithm to extract the isosurface generated from the Barth sextic function.
phi = (1 + np.sqrt(5)) / 2
phi2 = phi * phi


def barth_sextic(x, y, z):
    x2 = x * x
    y2 = y * y
    z2 = z * z
    arr = (
        3 * (phi2 * x2 - y2) * (phi2 * y2 - z2) * (phi2 * z2 - x2)
        - (1 + 2 * phi) * (x2 + y2 + z2 - 1) ** 2
    )
    nan_mask = x2 + y2 + z2 > 3.1
    arr[nan_mask] = np.nan
    return arr


# create a uniform grid to sample the function with
n = 100
k = 2.0
x_min, y_min, z_min = -k, -k, -k
grid = pv.ImageData(
    dimensions=(n, n, n),
    spacing=(abs(x_min) / n * 2, abs(y_min) / n * 2, abs(z_min) / n * 2),
    origin=(x_min, y_min, z_min),
)
x, y, z = grid.points.T

# sample and plot
values = barth_sextic(x, y, z)
mesh = grid.contour([0], values, method='flying_edges')
dist = np.linalg.norm(mesh.points, axis=1)
mesh.plot(scalars=dist, smooth_shading=True, cmap='plasma', show_scalar_bar=False)

Animate Barth Sextic#
Show 20 frames of various isocurves extracted from the Barth sextic function.
def angle_to_range(angle):
    return -2 * np.sin(angle)


pl = pv.Plotter(window_size=[800, 800], off_screen=True)

pl.open_gif('barth_sextic.gif')

for angle in np.linspace(0, np.pi, 20, endpoint=False):
    # clear the plotter before adding each frame's mesh
    pl.clear()
    pl.enable_lightkit()
    mesh = grid.contour([angle_to_range(angle)], values, method='flying_edges')
    dist = np.linalg.norm(mesh.points, axis=1)
    pl.add_mesh(
        mesh,
        scalars=dist,
        smooth_shading=True,
        rng=[0.5, 1.5],
        cmap='plasma',
        show_scalar_bar=False,
    )
    pl.write_frame()

pl.close()

Total running time of the script: (0 minutes 7.452 seconds)