Note
Go to the end to download the full example code.
Streamlines#
Integrate a vector field to generate streamlines.
This example generates streamlines of blood velocity. An isosurface of speed provides context. The starting positions for the streamtubes were determined by experimenting with the data.
import numpy as np
import pyvista as pv
from pyvista import examples
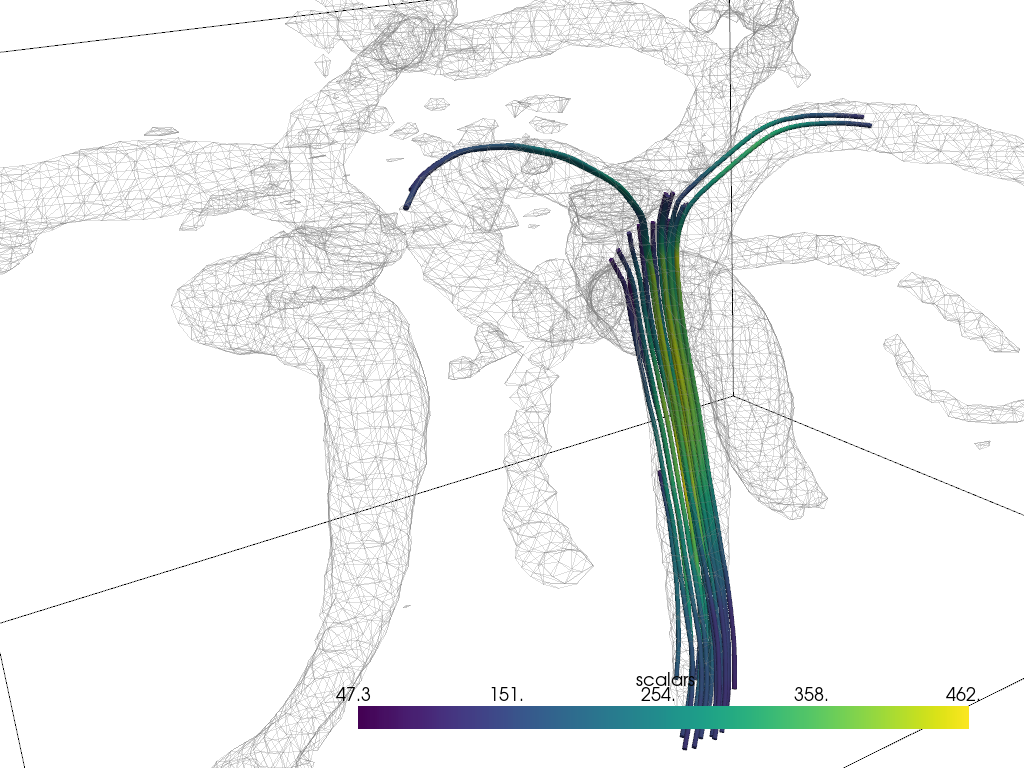
Carotid#
Download a sample dataset containing a vector field that can be integrated.
mesh = examples.download_carotid()
Run the stream line filtering algorithm using random seed points inside a sphere with radius of 2.0.
streamlines, src = mesh.streamlines(
    return_source=True,
    max_length=100.0,
    initial_step_length=2.0,
    terminal_speed=0.1,
    n_points=25,
    source_radius=2.0,
    source_center=(133.1, 116.3, 5.0),
)
Display the results. Please note that because this dataset’s velocity field was measured with low resolution, many streamlines travel outside the artery.
pl = pv.Plotter()
pl.add_mesh(mesh.outline(), color='k')
pl.add_mesh(streamlines.tube(radius=0.15))
pl.add_mesh(src)
pl.add_mesh(mesh.contour([160]).extract_all_edges(), color='grey', opacity=0.25)
pl.camera_position = pv.CameraPosition(
    position=(182.0, 177.0, 50), focal_point=(139, 105, 19), viewup=(-0.2, -0.2, 1)
)
pl.show()
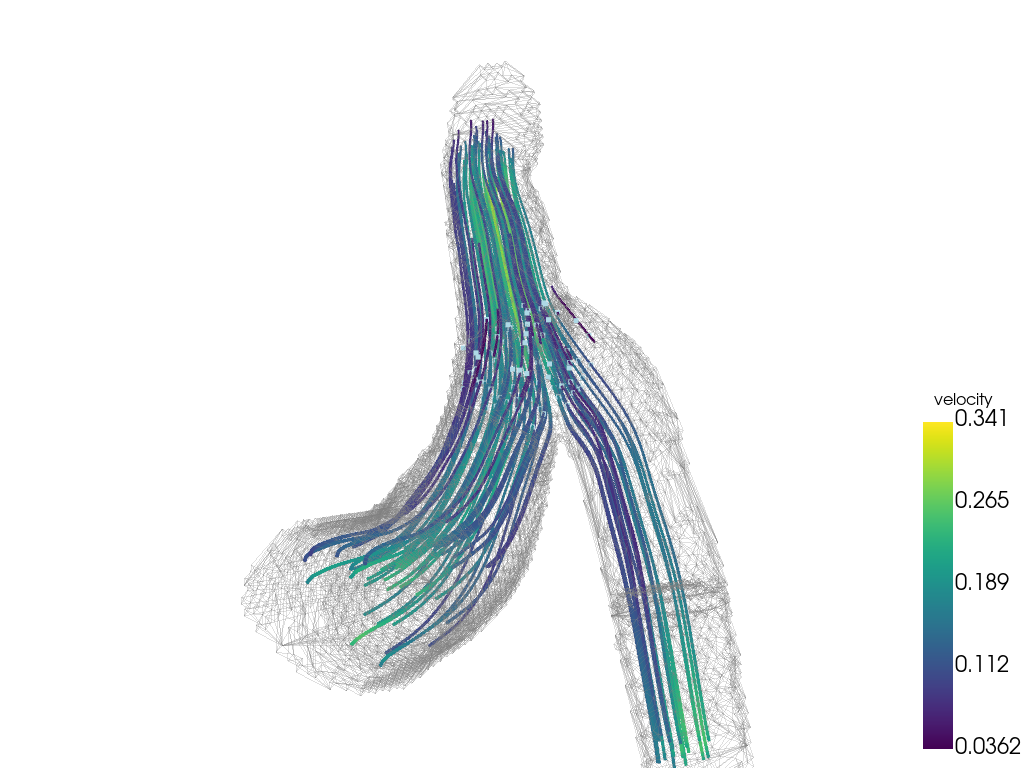
Blood Vessels#
Here is another example of blood flow:
mesh = examples.download_blood_vessels().cell_data_to_point_data()
mesh.set_active_scalars('velocity')
streamlines, src = mesh.streamlines(
    return_source=True,
    source_radius=10,
    source_center=(92.46, 74.37, 135.5),
)
boundary = mesh.decimate_boundary().extract_all_edges()

sargs = dict(vertical=True, title_font_size=16)
pl = pv.Plotter()
pl.add_mesh(streamlines.tube(radius=0.2), lighting=False, scalar_bar_args=sargs)
pl.add_mesh(src)
pl.add_mesh(boundary, color='grey', opacity=0.25)
pl.camera_position = pv.CameraPosition(
    position=(10, 9.5, -43), focal_point=(87.0, 73.5, 123.0), viewup=(-0.5, -0.7, 0.5)
)
pl.show()
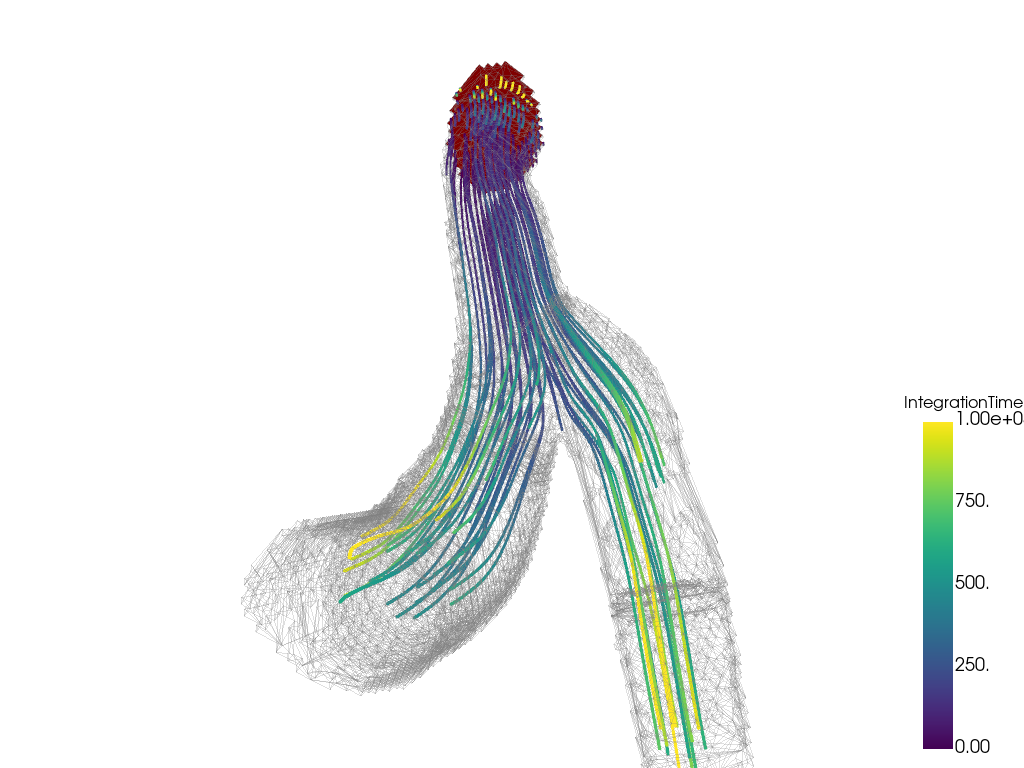
A source mesh can also be provided using the
pyvista.DataSetFilters.streamlines_from_source()
filter, for example if an inlet surface is available. In this example, the
inlet surface is extracted just inside the domain for use as the seed for
the streamlines.
source_mesh = mesh.slice('z', origin=(0, 0, 182))  # inlet surface
# thin out ~40% points to get a nice density of streamlines
seed_mesh = source_mesh.decimate_boundary(0.4)
streamlines = mesh.streamlines_from_source(seed_mesh, integration_direction='forward')
# print *only* added arrays from streamlines filter
print('Added arrays from streamlines filter:')
print(
    [
        array_name
        for array_name in streamlines.array_names
        if array_name not in mesh.array_names
    ]
)
Added arrays from streamlines filter:
['IntegrationTime', 'Vorticity', 'Rotation', 'AngularVelocity', 'Normals', 'ReasonForTermination', 'SeedIds']
Plot streamlines colored by the time along the streamlines.
sargs = dict(vertical=True, title_font_size=16)
pl = pv.Plotter()
pl.add_mesh(
    streamlines.tube(radius=0.2),
    scalars='IntegrationTime',
    clim=[0, 1000],
    lighting=False,
    scalar_bar_args=sargs,
)
pl.add_mesh(boundary, color='grey', opacity=0.25)
pl.add_mesh(source_mesh, color='red')
pl.camera_position = pv.CameraPosition(
    position=(10, 9.5, -43), focal_point=(87.0, 73.5, 123.0), viewup=(-0.5, -0.7, 0.5)
)
pl.show()
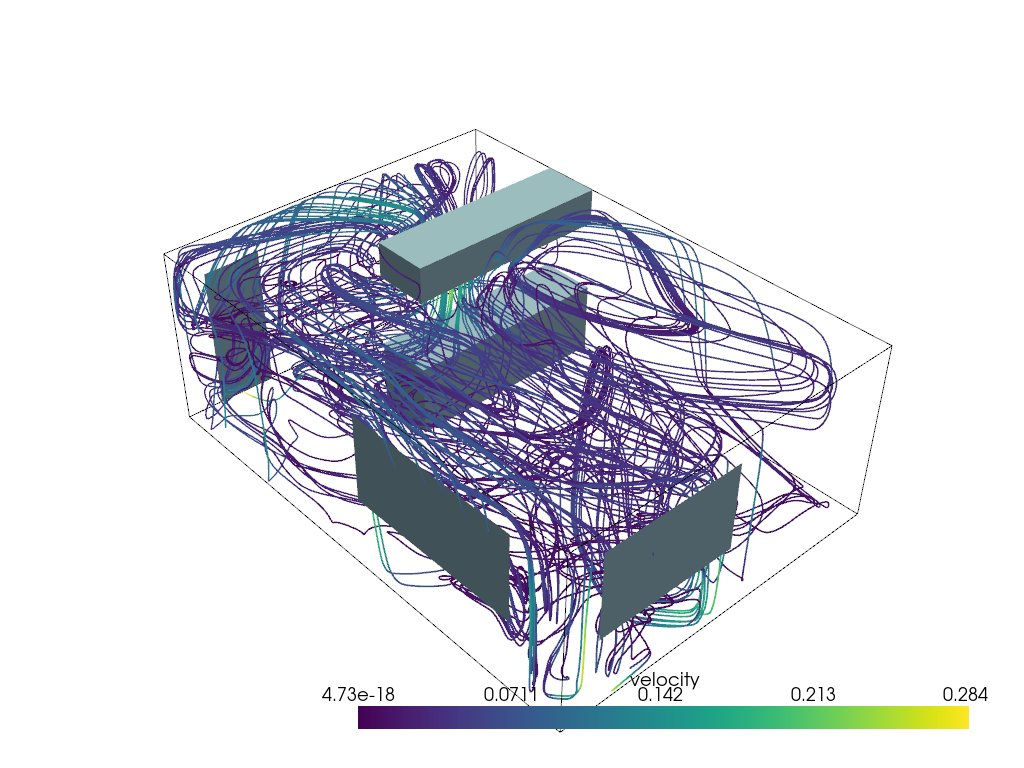
Kitchen#
kpos = pv.CameraPosition(
    position=(-6.68, 11.9, 11.6), focal_point=(3.5, 2.5, 1.26), viewup=(0.45, -0.4, 0.8)
)

mesh = examples.download_kitchen()
kitchen = examples.download_kitchen(split=True)
streamlines = mesh.streamlines(n_points=40, source_center=(0.08, 3, 0.71), max_length=200)
pl = pv.Plotter()
pl.add_mesh(mesh.outline(), color='k')
pl.add_mesh(kitchen, color=True)
pl.add_mesh(streamlines.tube(radius=0.01), scalars='velocity', lighting=False)
pl.camera_position = kpos
pl.show()
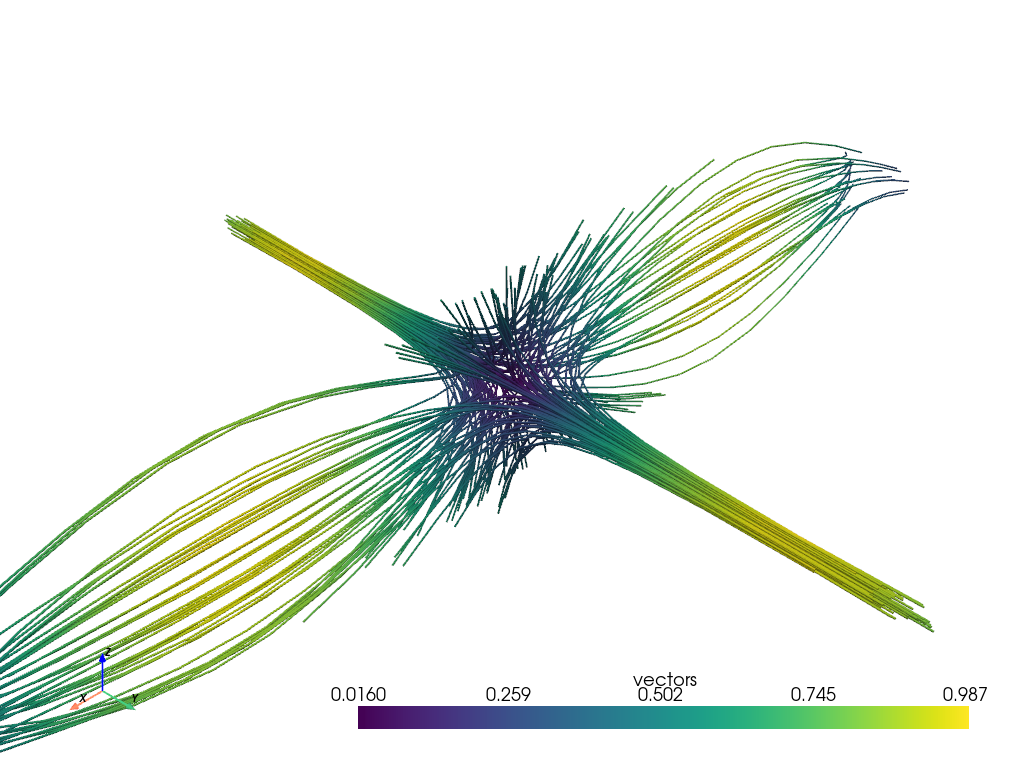
Custom 3D Vector Field#
nx = 20
ny = 15
nz = 5

origin = (-(nx - 1) * 0.1 / 2, -(ny - 1) * 0.1 / 2, -(nz - 1) * 0.1 / 2)
mesh = pv.ImageData(dimensions=(nx, ny, nz), spacing=(0.1, 0.1, 0.1), origin=origin)
x = mesh.points[:, 0]
y = mesh.points[:, 1]
z = mesh.points[:, 2]
vectors = np.empty((mesh.n_points, 3))
vectors[:, 0] = np.sin(np.pi * x) * np.cos(np.pi * y) * np.cos(np.pi * z)
vectors[:, 1] = -np.cos(np.pi * x) * np.sin(np.pi * y) * np.cos(np.pi * z)
vectors[:, 2] = (
    np.sqrt(3.0 / 3.0) * np.cos(np.pi * x) * np.cos(np.pi * y) * np.sin(np.pi * z)
)

mesh['vectors'] = vectors
stream, src = mesh.streamlines(
    'vectors',
    return_source=True,
    terminal_speed=0.0,
    n_points=200,
    source_radius=0.1,
)
cpos = pv.CameraPosition(
    position=(1.2, 1.2, 1.2), focal_point=(-0.0, -0.0, -0.0), viewup=(0.0, 0.0, 1.0)
)
stream.tube(radius=0.0015).plot(cpos=cpos)
Total running time of the script: (0 minutes 12.228 seconds)
