Plotter.add_points#
- Plotter.add_points(
- points: MatrixLike[float] | VectorLike[float] | DataSet,
- style: Literal['points', 'points_gaussian'] = 'points',
- **kwargs,
Add points to a mesh.
- Parameters:
- points
numpy.ndarrayorpyvista.DataSet Array of points or the points from a pyvista object.
- style
str, default: ‘points’ Visualization style of the mesh. One of the following:
style='points',style='points_gaussian'.'points_gaussian'can be controlled with theemissiveandrender_points_as_spheresoptions.- **kwargs
dict,optional See
pyvista.Plotter.add_mesh()for optional keyword arguments.
- points
- Returns:
pyvista.ActorActor of the mesh.
See also
Examples
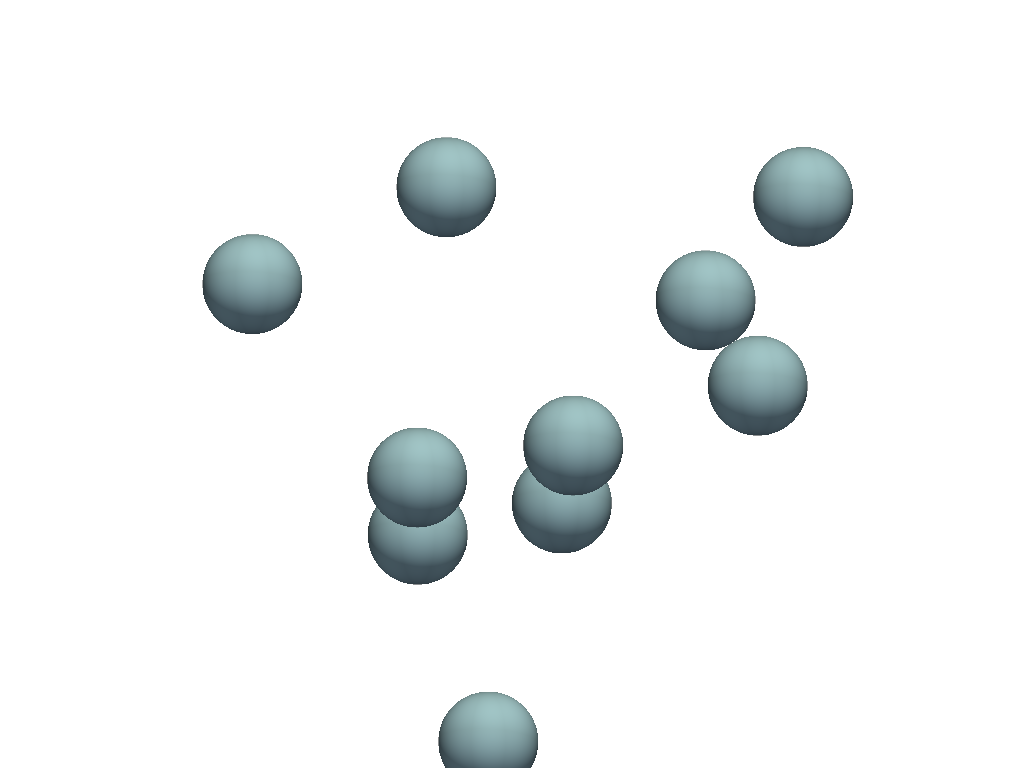
Add a numpy array of points to a mesh.
>>> import numpy as np
>>> import pyvista as pv
>>> rng = np.random.default_rng(seed=0)
>>> points = rng.random((10, 3))
>>> pl = pv.Plotter()
>>> actor = pl.add_points(
...     points, render_points_as_spheres=True, point_size=100.0
... )
>>> pl.show()
Plot using the
'points_gaussian'style>>> points = rng.random((10, 3)) >>> pl = pv.Plotter() >>> actor = pl.add_points(points, style='points_gaussian') >>> pl.show()