
Adding a New Gallery Example#
Download Python source code | Download Jupyter notebook
Add a new PyVista Sphinx Gallery example using this file as a template.
See Sphinx Gallery for background on the format.
Each example should have a reference anchor in the form:
.. _<example_name>_example:
The .. _ is necessary. Everything that follows is your reference anchor, which
can potentially be used within a docstring. As convention, we keep all
references all in snake_case.
This section should give a brief overview of what the example is about and/or demonstrates. The title should be changed to reflect the topic your example covers.
New examples should be added as python scripts to:
examples/<index>-<directory-name>/<some_example>.py
Note
Avoid creating new directories unless absolutely necessary. If you must
create a new folder, make sure to add a README.txt containing a
reference, a title and a single sentence description of the folder.
Otherwise the new folder will be ignored by Sphinx.
Example file names should be underscore-separated snake case:
some_example.py
After this preamble is complete, the first code block begins. This is where you typically set up your imports.
Note
By default, the documentation scrapper will generate both a static image and an interactive widget for each plot. If you want to turn this feature off, define at the top of your file:
# \sphinx_gallery_start_ignore (remove the \)
PYVISTA_GALLERY_FORCE_STATIC_IN_DOCUMENT = True
# \sphinx_gallery_end_ignore (remove the \)
Note that the sphinx_gallery_start_ignore and sphinx_gallery_end_ignore
flags have been escaped to appear in the current documentation.
See Sphinx-Gallery documentation
for more details.
If you want to use static images only for some of your plots, define
PYVISTA_GALLERY_FORCE_STATIC before the plot/show command that
produces the image you want to turn into static:
Section Title#
Code blocks can be broken up with text “sections” which are interpreted as restructured text.
This will also be translated into a markdown cell in the generated jupyter notebook or the HTML page.
Sections can contain any information you may have regarding the example such as step-by-step comments or notes regarding motivations etc.
As in Jupyter notebooks, if a statement is unassigned at the end of a code
block, output will be generated and printed to the screen according to its
__repr__ method. Otherwise, you can use print() to output text.
Plots and Images#
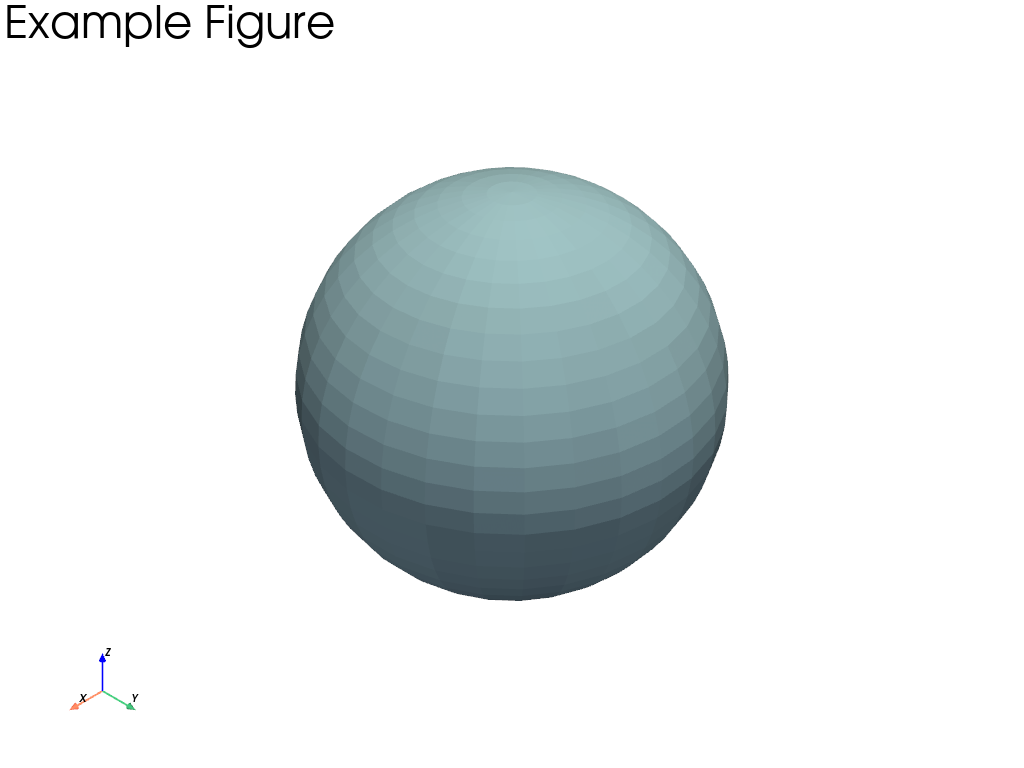
If you use anything that outputs an image (for example,
pyvista.Plotter.show()) the resulting image will be rendered within the
output HTML.
Note
Unless sphinx_gallery_thumbnail_number = <int> is included at the top
of the example script, first figure (this one) will be used for the
gallery thumbnail image.
Also note that this image number uses one based indexing.
dataset.plot(text='Example Figure')
Caveat - Plotter Must Be Within One Cell#
It’s not possible for a single pyvista.Plotter object across
multiple cells because these are closed out automatically at the end of a
cell.
Here we just exercise the pyvista.Actor repr for demonstrating
why you might want to instantiate a plotter without showing it in the same
cell.
pl = pv.Plotter()
actor = pl.add_mesh(dataset)
actor
Actor (0x7fc1156e7580)
Center: (0.0, 0.0, 0.0)
Pickable: True
Position: (0.0, 0.0, 0.0)
Scale: (1.0, 1.0, 1.0)
Visible: True
X Bounds -4.993E-01, 4.993E-01
Y Bounds -4.965E-01, 4.965E-01
Z Bounds -5.000E-01, 5.000E-01
User matrix: Identity
Has mapper: True
Property (0x7fc1156e6860)
Ambient: 0.0
Ambient color: Color(name='light_blue', hex='#add8e6ff', opacity=255)
Anisotropy: 0.0
Anisotropy rotation: 0.0
Color: Color(name='light_blue', hex='#add8e6ff', opacity=255)
Culling: "none"
Diffuse: 1.0
Diffuse color: Color(name='light_blue', hex='#add8e6ff', opacity=255)
Edge color: Color(name='black', hex='#000000ff', opacity=255)
Edge opacity: 1.0
Index of refraction: 1.5
Interpolation: InterpolationType.FLAT
Lighting: True
Line width: 1.0
Metallic: 0.0
Opacity: 1.0
Point shape: "square"
Point size: 5.0
Render lines as tubes: False
Render points as spheres: False
Representation: RepresentationType.SURFACE
Roughness: 0.5
Show edges: False
Specular: 0.0
Specular color: Color(name='light_blue', hex='#add8e6ff', opacity=255)
Specular power: 100.0
Style: "Surface"
DataSetMapper (0x7fc1156e6860)
Scalar visibility: False
Scalar range: (0.0, 1.0)
Interpolate before mapping: True
Scalar map mode: default
Color mode: direct
Attached dataset:
PolyData (0x7fc1156e5540)
  N Cells:    1680
  N Points:   842
  N Strips:   0
  X Bounds:   -4.993e-01, 4.993e-01
  Y Bounds:   -4.965e-01, 4.965e-01
  Z Bounds:   -5.000e-01, 5.000e-01
  N Arrays:   1
This Cell Cannot Run the Plotter#
The plotter will already be closed by sphinx_gallery.
# This cannot be run here because the plotter is already closed and would raise
# an error:
# >>> pl.show()

# You can, however, close out the plotter or access other attributes.
pl.close()
Animations#
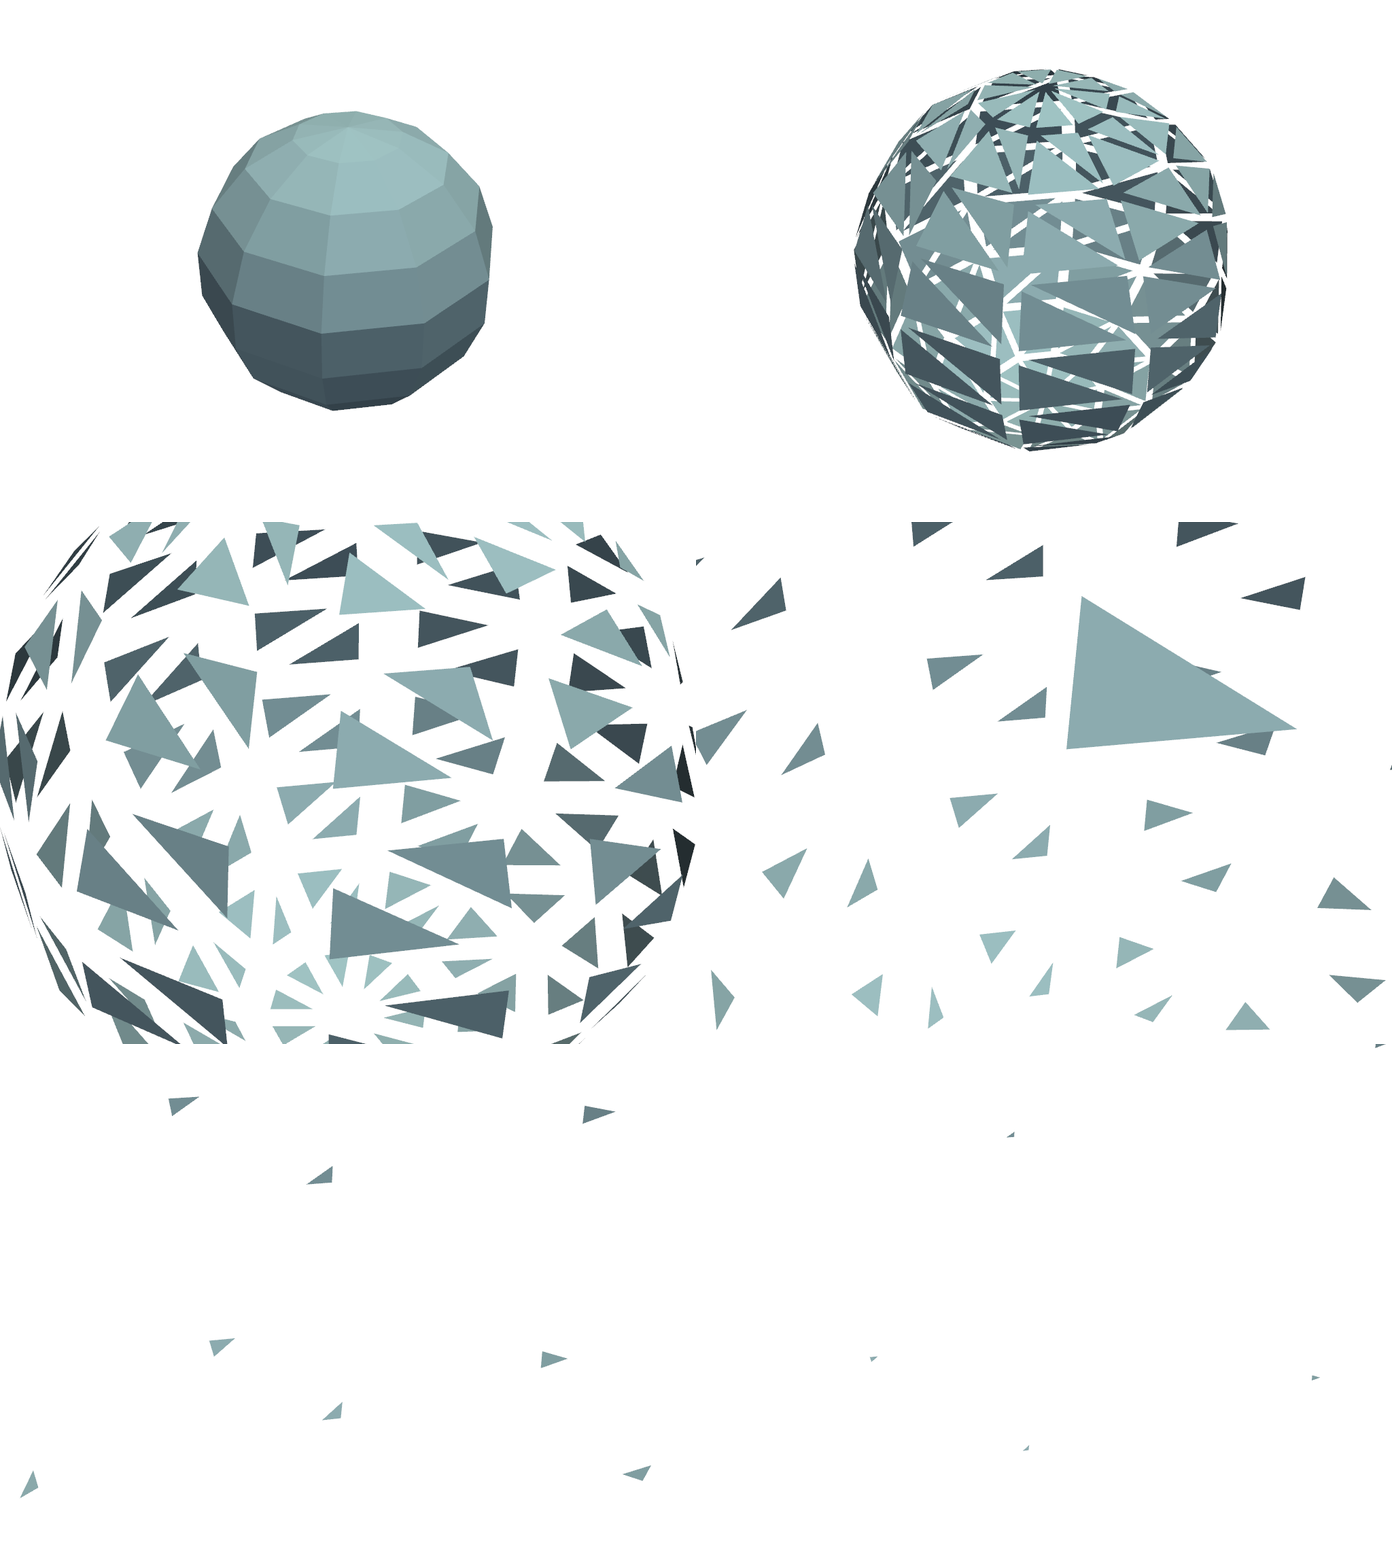
You can even create animations, and while there is a full example in Create a MP4 Movie, this cell explains how you can create an animation within a single cell.
Here, we explode a simple sphere.
pl = pv.Plotter(off_screen=True)

# optimize for size
pl.open_gif('example_movie.gif', palettesize=16)

sphere = pv.Sphere(theta_resolution=10, phi_resolution=10)

# Add initial mesh to setup the camera
actor = pl.add_mesh(sphere)
pl.background_color = 'w'

# clear and overwrite the mesh on each frame
n_frames = 20
for i in range(n_frames):
    exploded = sphere.explode(factor=i / (n_frames * 2)).extract_surface(algorithm=None)
    actor.mapper.dataset.copy_from(exploded)
    pl.camera.reset_clipping_range()
    pl.write_frame()  # Write this frame

# Be sure to close the plotter when finished
pl.close()
Adding Example Files#
PyVista has a variety of example files all stored at pyvista/data, and you can add the file by following the directions there.
Under the hood, PyVista uses pooch,
and you can easily access any files added with
pyvista.examples.downloads.download_file().
filename = examples.download_file('bunny.ply')
filename
'/home/runner/.cache/pyvista_3/bunny.ply'
Adding a Wrapped Example#
While it’s possible to simply download a file and then read it in, it’s
better for you to write a wrapped download_<example_dataset>() within
/pyvista/examples/downloads.py. For example download_bunny() downloads and reads with
pyvista.read().
If you intend on adding an example file, you should add a new function in
downloads.py to make it easy for users to add example files.
Making a Pull Request#
Once your example is complete and you’ve verified it builds locally, you can make a pull request (PR).
Branches containing examples should be prefixed with docs/ as per the branch naming conventions found in out Contributing Guidelines.
Note
You only need to create the Python source example (*.py). The jupyter
notebook and the example HTML will be auto-generated via sphinx-gallery.
Total running time of the script: (0 minutes 1.617 seconds)
