Helpers#
The pyvista module contains several functions to simplify the
creation and manipulation of meshes or interfacing with VTK datasets.
Wrap a VTK Dataset#
- helpers.wrap() DataObject | pyvista_ndarray | None[source]#
Wrap any given VTK data object to its appropriate PyVista data object.
Other formats that are supported include:
2D
numpy.ndarrayof XYZ vertices3D
numpy.ndarrayrepresenting a volume. Values will be scalars.3D
trimesh.Trimeshmesh usingfrom_trimesh().3D
meshio.Meshmesh usingfrom_meshio().
Changed in version 0.38.0: If the passed object is already a wrapped PyVista object, then this is no-op and will return that object directly. In previous versions of PyVista, this would perform a shallow copy.
Changed in version 0.47: If wrapping a
Trimeshobject, any arrays are now wrapped directly (no copies).- Parameters:
- dataset
numpy.ndarray|trimesh.Trimesh|vtk.DataSet Dataset to wrap.
- dataset
- Returns:
pyvista.DataSetThe PyVista wrapped dataset.
See also
Examples
Wrap a numpy array representing a random point cloud.
>>> import numpy as np
>>> import pyvista as pv
>>> points = np.random.default_rng().random((10, 3))
>>> cloud = pv.wrap(points)
>>> cloud
PolyData (...)
  N Cells:    10
  N Points:   10
  N Strips:   0
  X Bounds:   ...
  Y Bounds:   ...
  Z Bounds:   ...
  N Arrays:   0
Wrap a VTK object.
>>> import pyvista as pv
>>> import vtk
>>> points = vtk.vtkPoints()
>>> p = [1.0, 2.0, 3.0]
>>> vertices = vtk.vtkCellArray()
>>> pid = points.InsertNextPoint(p)
>>> _ = vertices.InsertNextCell(1)
>>> _ = vertices.InsertCellPoint(pid)
>>> point = vtk.vtkPolyData()
>>> _ = point.SetPoints(points)
>>> _ = point.SetVerts(vertices)
>>> mesh = pv.wrap(point)
>>> mesh
PolyData (...)
  N Cells:    1
  N Points:   1
  N Strips:   0
  X Bounds:   1.000e+00, 1.000e+00
  Y Bounds:   2.000e+00, 2.000e+00
  Z Bounds:   3.000e+00, 3.000e+00
  N Arrays:   0
Wrap a Trimesh object.
>>> import trimesh
>>> import pyvista as pv
>>> points = [[0, 0, 0], [0, 0, 1], [0, 1, 0]]
>>> faces = [[0, 1, 2]]
>>> tmesh = trimesh.Trimesh(points, faces=faces, process=False)
>>> mesh = pv.wrap(tmesh)
>>> mesh
PolyData (0x7fc55ff27ad0)
  N Cells:  1
  N Points: 3
  X Bounds: 0.000e+00, 0.000e+00
  Y Bounds: 0.000e+00, 1.000e+00
  Z Bounds: 0.000e+00, 1.000e+00
  N Arrays: 0
Simplified Triangular Mesh Construction#
- points.make_tri_mesh(faces: NumpyArray[int]) PolyData[source]#
Construct a
pyvista.PolyDatamesh using points and faces arrays.Construct a mesh from an Nx3 array of points and an Mx3 array of triangle indices, resulting in a mesh with N vertices and M triangles. This function does not require the standard VTK “padding” column and simplifies mesh creation.
- Parameters:
- points
np.ndarray Array of points with shape
(N, 3)storing the vertices of the triangle mesh.- faces
np.ndarray Array of indices with shape
(M, 3)containing the triangle indices.
- points
- Returns:
pyvista.PolyDataPolyData instance containing the triangle mesh.
Examples
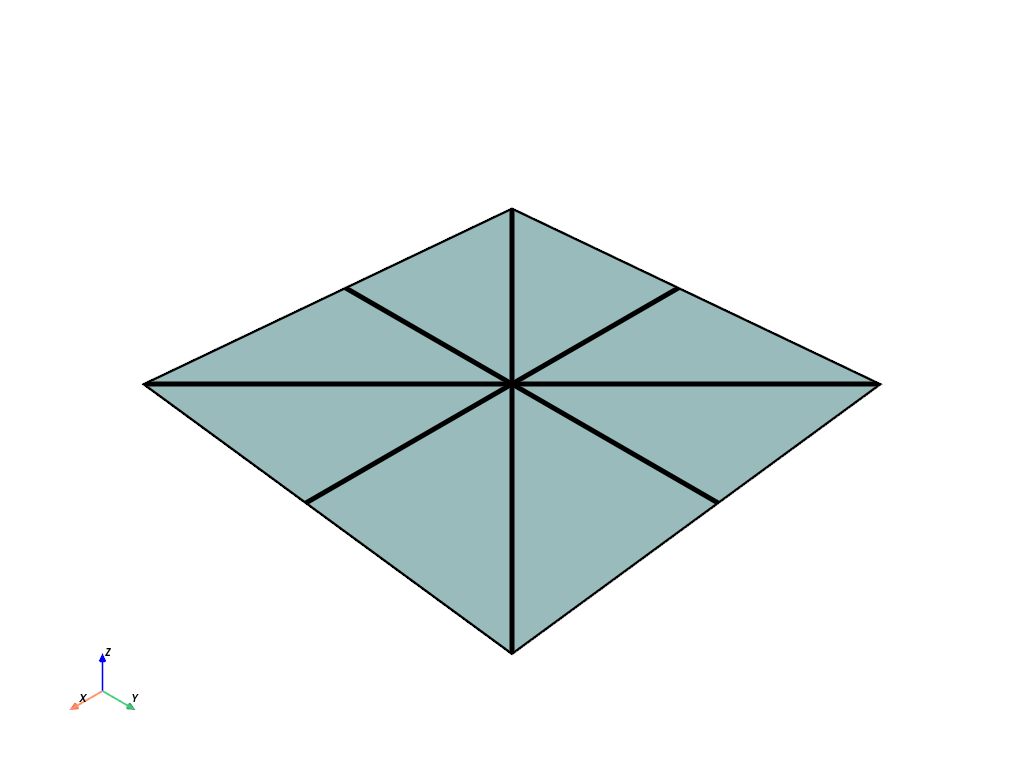
This example discretizes the unit square into a triangle mesh with nine vertices and eight faces.
>>> import numpy as np
>>> import pyvista as pv
>>> points = np.array(
...     [
...         [0, 0, 0],
...         [0.5, 0, 0],
...         [1, 0, 0],
...         [0, 0.5, 0],
...         [0.5, 0.5, 0],
...         [1, 0.5, 0],
...         [0, 1, 0],
...         [0.5, 1, 0],
...         [1, 1, 0],
...     ]
... )
>>> faces = np.array(
...     [
...         [0, 1, 4],
...         [4, 7, 6],
...         [2, 5, 4],
...         [4, 5, 8],
...         [0, 4, 3],
...         [3, 4, 6],
...         [1, 2, 4],
...         [4, 8, 7],
...     ]
... )
>>> tri_mesh = pv.make_tri_mesh(points, faces)
>>> tri_mesh.plot(show_edges=True, line_width=5)
Lines from Points#
- points.lines_from_points(close: bool = False) PolyData[source]#
Make a connected line set given an array of points.
- Parameters:
- pointsarray_like[
float] Points representing the vertices of the connected segments. For example, two line segments would be represented as
np.array([[0, 0, 0], [1, 0, 0], [1, 1, 0]]).- closebool, default:
False If
True, close the line segments into a loop.
- pointsarray_like[
- Returns:
pyvista.PolyDataPolyData with lines and cells.
Examples
>>> import numpy as np
>>> import pyvista as pv
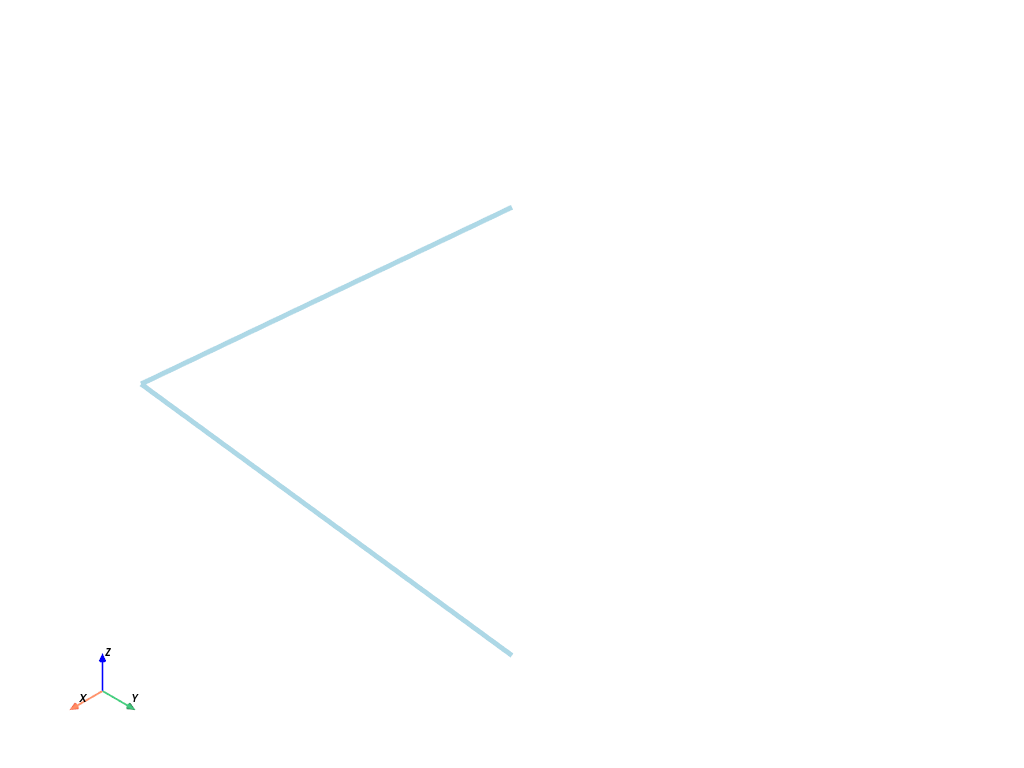
>>> points = np.array([[0, 0, 0], [1, 0, 0], [1, 1, 0]])
>>> poly = pv.lines_from_points(points)
>>> poly.plot(line_width=5)
Line Segments from Points#
- points.line_segments_from_points() PolyData[source]#
Generate non-connected line segments from points.
Assumes points are ordered as line segments and an even number of points.
- Parameters:
- pointsarray_like[
float] Points representing line segments. An even number must be given as every two vertices represent a single line segment. For example, two line segments would be represented as
np.array([[0, 0, 0], [1, 0, 0], [1, 0, 0], [1, 1, 0]]).
- pointsarray_like[
- Returns:
pyvista.PolyDataPolyData with lines and cells.
Examples
This example plots two line segments at right angles to each other.
>>> import pyvista as pv
>>> import numpy as np
>>> points = np.array([[0, 0, 0], [1, 0, 0], [1, 0, 0], [1, 1, 0]])
>>> lines = pv.line_segments_from_points(points)
>>> lines.plot()
Convert to and from VTK Data Types#
- arrays.convert_array( ) ndarray[tuple[Any, ...], dtype[Any]] | vtkAbstractArray | None[source]#
Convert a NumPy array to a vtkDataArray or vice versa.
- Parameters:
- arr
np.ndarray| vtkDataArray A numpy array or vtkDataArray to convert.
- name
str,optional The name of the data array for VTK.
- deepbool, default:
False If input is numpy array then deep copy values.
- array_type
int,optional VTK array type ID as specified in
vtkType.h.
- arr
- Returns:
- outputvtkDataArray |
numpy.ndarray The converted array. If input is a
numpy.ndarraythen returns vtkDataArray or if input is vtkDataArray then returns NumPyndarray.
- outputvtkDataArray |
Fit Plane to Points#
- points.fit_plane_to_points( ) PolyData | tuple[PolyData, float, NumpyArray[float]][source]#
Fit a plane to points using its
principal_axes().The plane is automatically sized and oriented to fit the extents of the points.
Changed in version 0.42.0: The generated plane is now sized and oriented to match the points.
Changed in version 0.42.0: The center of the plane (returned if
return_meta=True) is now computed as the center of the generated plane mesh. In previous versions, the center of the input points was returned.Changed in version 0.45.0: The internal method used for fitting the plane has changed. Previously, singular value decomposition (SVD) was used, but eigenvectors are now used instead. See warning below.
Warning
The sign of the plane’s normal vector prior to version 0.45 may differ from the latest version. This may impact methods which rely on the plane’s direction. Use
init_normalto control the sign explicitly.- Parameters:
- pointsarray_like[
float] Size
[N x 3]sequence of points to fit a plane through.- return_metabool, default:
False If
True, also returns the center and normal of the generated plane.- resolution
int, default: 10 Number of points on the plane mesh along its edges. Specify two numbers to set the resolution along the plane’s long and short edge (respectively) or a single number to set both edges to have the same resolution.
Added in version 0.45.0.
- init_normal
VectorLike[float] |str,optional Flip the normal of the plane such that it best aligns with this vector. Can be a vector or string specifying the axis by name (e.g.
'x'or'-x', etc.).Added in version 0.45.0.
- pointsarray_like[
- Returns:
pyvista.PolyDataPlane mesh.
pyvista.pyvista_ndarrayPlane center if
return_meta=True.pyvista.pyvista_ndarrayPlane normal if
return_meta=True.
See also
fit_line_to_pointsFit a line using the first principal axis of the points.
principal_axesCompute axes vectors which best fit a set of points.
Examples
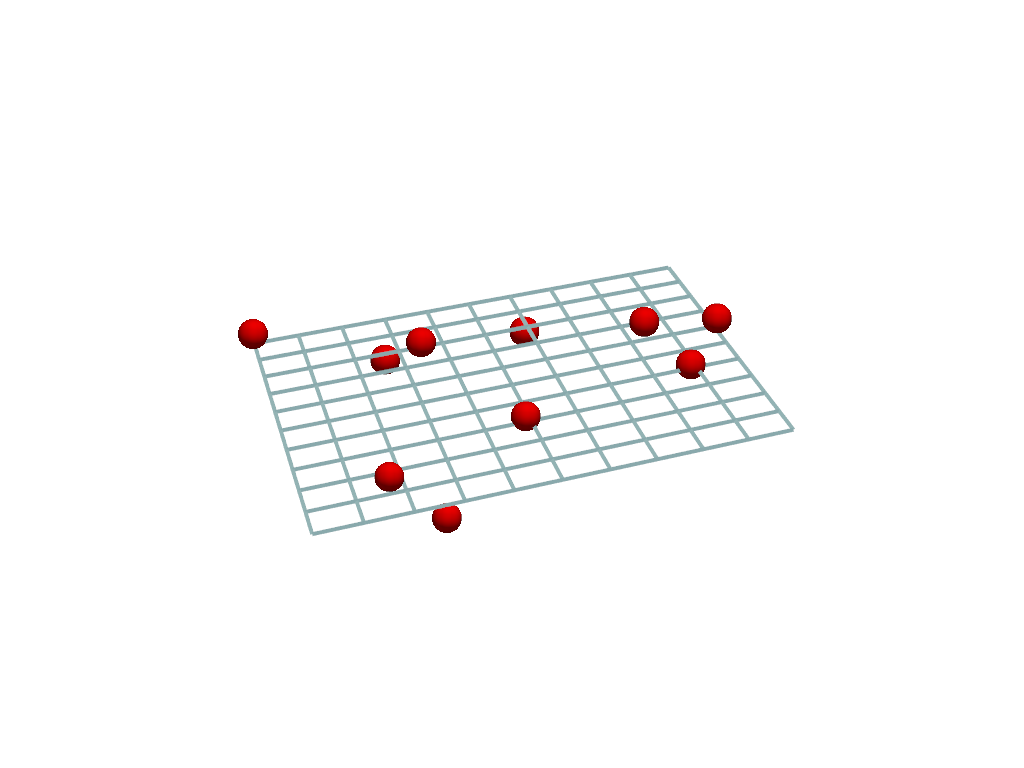
Fit a plane to a random point cloud.
>>> import pyvista as pv
>>> import numpy as np
>>> from pyvista import examples
>>>
>>> rng = np.random.default_rng(seed=0)
>>> cloud = rng.random((10, 3))
>>> cloud[:, 2] *= 0.1
>>>
>>> plane = pv.fit_plane_to_points(cloud)
Plot the point cloud and fitted plane.
>>> pl = pv.Plotter()
>>> _ = pl.add_mesh(plane, style='wireframe', line_width=4)
>>> _ = pl.add_points(
...     cloud,
...     render_points_as_spheres=True,
...     color='r',
...     point_size=30,
... )
>>> pl.show()
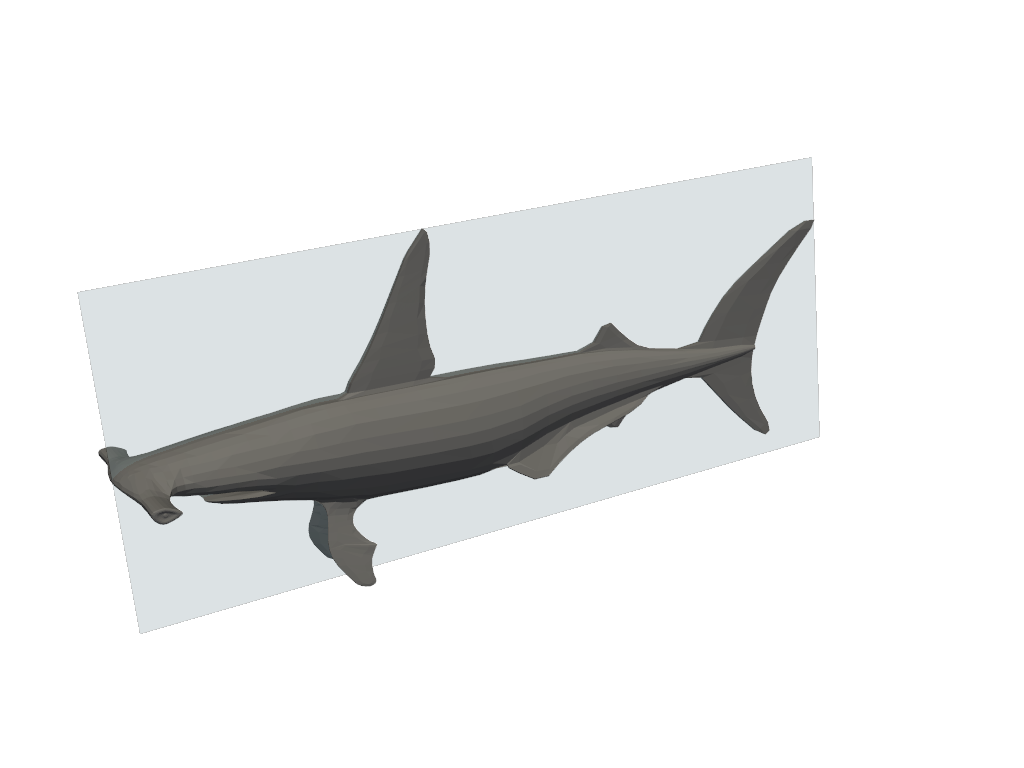
Fit a plane to a mesh and return its metadata. Set the plane resolution to 1 so that the plane has no internal points or edges.
>>> mesh = examples.download_shark()
>>> plane, center, normal = pv.fit_plane_to_points(
...     mesh.points, return_meta=True, resolution=1
... )
Plot the mesh and fitted plane.
>>> pl = pv.Plotter()
>>> _ = pl.add_mesh(plane, show_edges=True, opacity=0.25)
>>> _ = pl.add_mesh(mesh, color='gray')
>>> pl.camera_position = pv.CameraPosition(
...     position=(-117, 76, 235),
...     focal_point=(1.69, -1.38, 0),
...     viewup=(0.189, 0.957, -0.22),
... )
>>> pl.show()
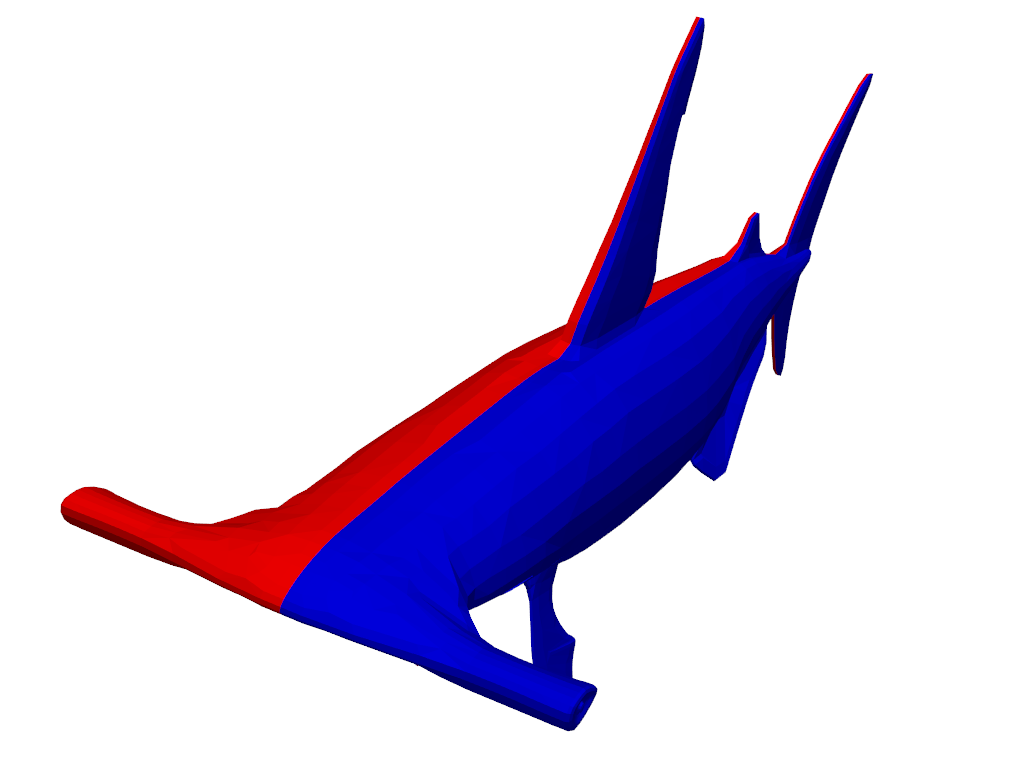
Use the metadata with
pyvista.DataObjectFilters.clip()to split the mesh into two.>>> first_half, second_half = mesh.clip( ... origin=center, normal=normal, return_clipped=True ... )
Plot the two halves of the clipped mesh.
>>> pl = pv.Plotter()
>>> _ = pl.add_mesh(first_half, color='red')
>>> _ = pl.add_mesh(second_half, color='blue')
>>> pl.camera_position = pv.CameraPosition(
...     position=(-143, 43, 40),
...     focal_point=(-8.7, -11, -14),
...     viewup=(0.25, 0.92, -0.29),
... )
>>> pl.show()
Note that it is pointing in the positive z-direction.
>>> normal
pyvista_ndarray([0.0, 0.0, 1.0], dtype=float32)
Use
init_normalto flip the sign and make it negative instead.>>> _, _, normal = pv.fit_plane_to_points( ... mesh.points, return_meta=True, init_normal='-z' ... ) >>> normal pyvista_ndarray([0.0, 0.0, -1.0], dtype=float32)
Fit Line to Points#
- points.fit_line_to_points( ) PolyData | tuple[PolyData, float, NumpyArray[float]][source]#
Fit a line to points using its
principal_axes().The line is automatically sized and oriented to fit the extents of the points.
Added in version 0.45.0.
- Parameters:
- points
MatrixLike[float] Size
[N x 3]array of points to fit a line through.- resolution
int, default: 1 Number of pieces to divide the line into.
- init_direction
VectorLike[float],optional Flip the direction of the line’s points such that it best aligns with this vector. Can be a vector or string specifying the axis by name (e.g.
'x'or'-x', etc.).- return_metabool, default:
False If
True, also returns the length (magnitude) and direction of the line.
- points
- Returns:
pyvista.PolyDataLine mesh.
floatLine length if
return_meta=True.numpy.ndarrayLine direction (unit vector) if
return_meta=True.
See also
fit_plane_to_pointsFit a plane using the first two principal axes of the points.
principal_axesCompute axes vectors which best fit a set of points.
Examples
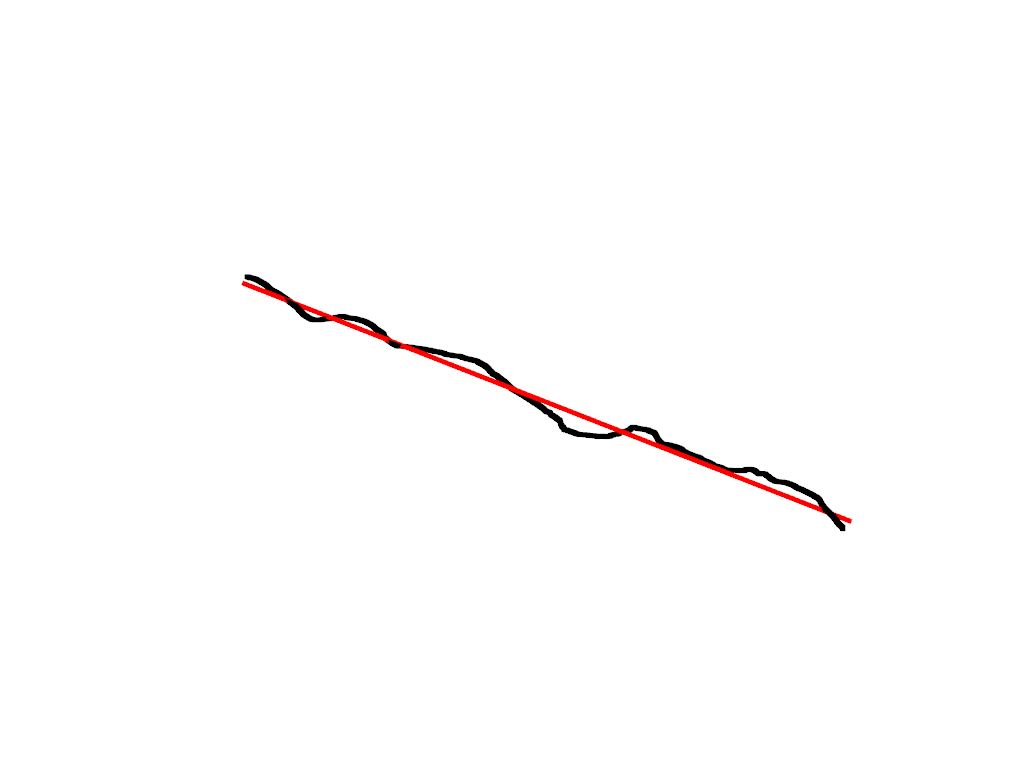
Download a point cloud. The points trace a path along topographical surface.
>>> import pyvista as pv
>>> from pyvista import examples
>>> mesh = examples.download_gpr_path()
Fit a line to the points and plot the result. The line of best fit is colored red.
>>> line = pv.fit_line_to_points(mesh.points)
>>> pl = pv.Plotter()
>>> _ = pl.add_mesh(mesh, color='black', line_width=10)
>>> _ = pl.add_mesh(line, color='red', line_width=5)
>>> pl.show()
Fit a line to a mesh and return the metadata.
>>> mesh = examples.download_human()
>>> line, length, direction = pv.fit_line_to_points(
...     mesh.points, return_meta=True
... )
Show the length of the line.
>>> length
167.6145
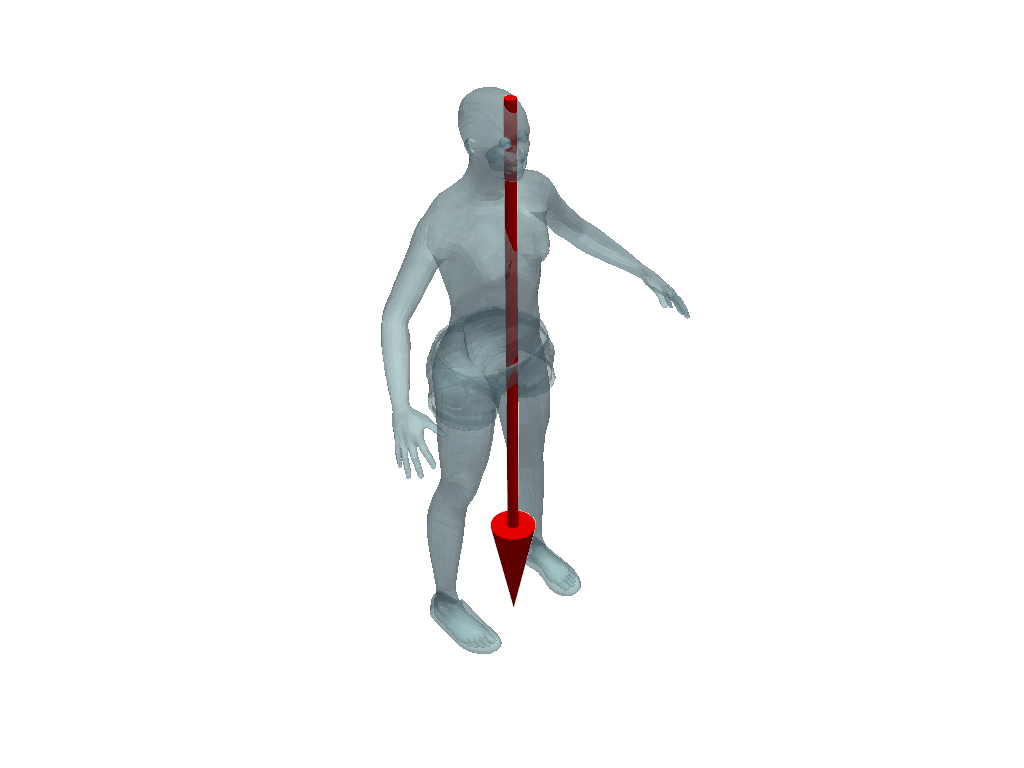
Plot the line as an arrow to show its direction.
>>> arrow = pv.Arrow(
...     start=line.points[0],
...     direction=direction,
...     scale=length,
...     tip_length=0.2,
...     tip_radius=0.04,
...     shaft_radius=0.01,
... )
>>> pl = pv.Plotter()
>>> _ = pl.add_mesh(mesh, opacity=0.5)
>>> _ = pl.add_mesh(arrow, color='red')
>>> pl.show()
Set
init_directionto the positive z-axis to flip the line’s direction.>>> mesh = examples.download_human() >>> line, length, direction = pv.fit_line_to_points( ... mesh.points, init_direction='z', return_meta=True ... )
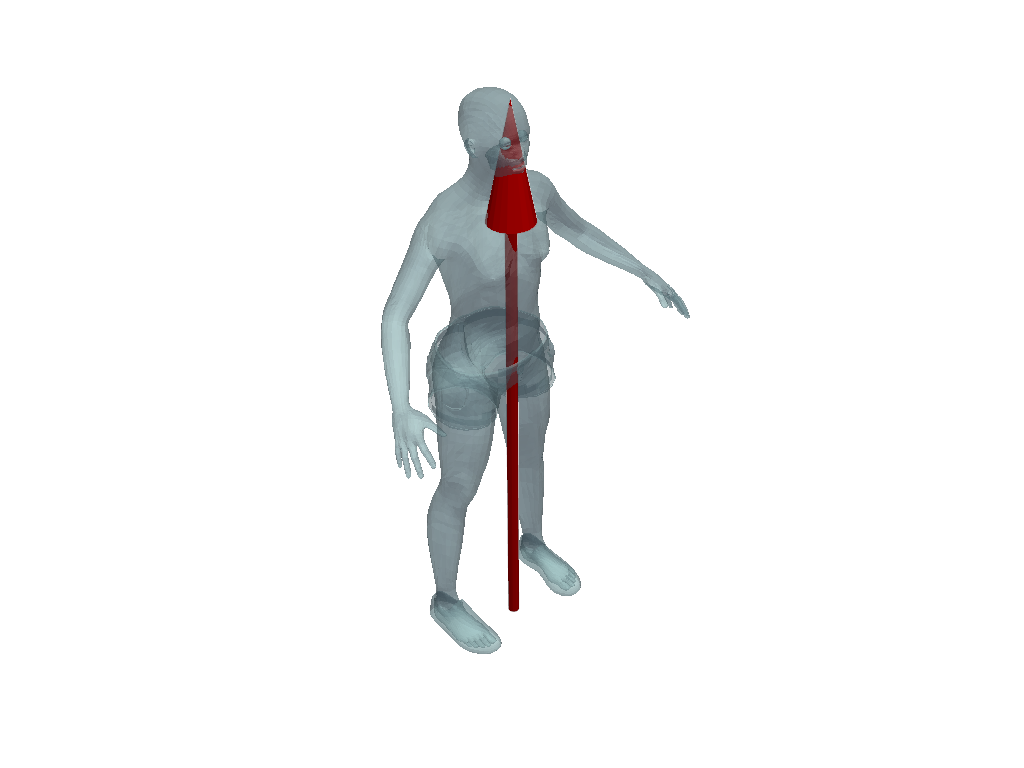
Plot the results again with an arrow.
>>> arrow = pv.Arrow(
...     start=line.points[0],
...     direction=direction,
...     scale=length,
...     tip_length=0.2,
...     tip_radius=0.04,
...     shaft_radius=0.01,
... )
>>> pl = pv.Plotter()
>>> _ = pl.add_mesh(mesh, opacity=0.5)
>>> _ = pl.add_mesh(arrow, color='red')
>>> pl.show()
