Note
Go to the end to download the full example code.
Integrate Data#
Integrate data over a surface using the
pyvista.DataSetFilters.integrate_data() filter.
from __future__ import annotations

import pyvista
from pyvista import examples
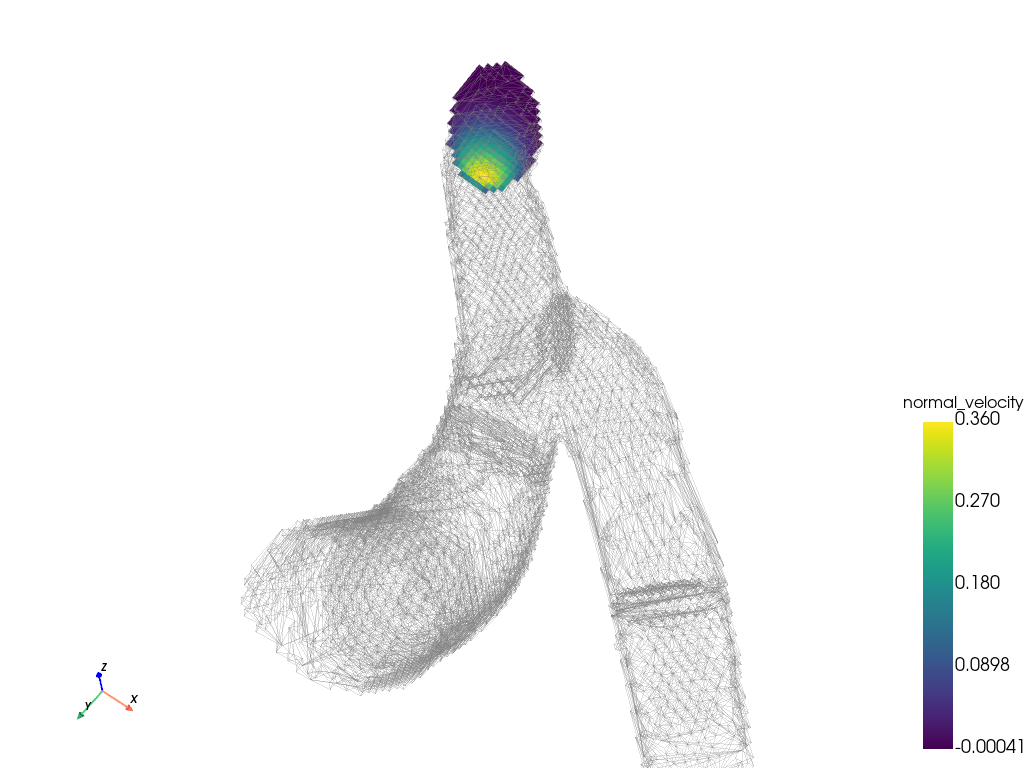
This example calculates the total flow rate and average velocity inside a
blood vessel. The boundary object is only used for plotting the shape of
the dataset geometry. The inlet surface is generated by slicing the domain.
Fluid flowing into the domain is in the negative z-direction, so
a new array, normal_velocity, is created.
dataset = examples.download_blood_vessels()
boundary = dataset.decimate_boundary().extract_all_edges()
inlet_surface = dataset.slice('z', origin=(0, 0, 182))
inlet_surface['normal_velocity'] = -1 * inlet_surface['velocity'][:, 2]
The velocity in the inlet is shown.
plotter = pyvista.Plotter()
plotter.add_mesh(boundary, color='grey', opacity=0.25)
plotter.add_mesh(
    inlet_surface,
    scalars='normal_velocity',
    component=2,
    scalar_bar_args=dict(vertical=True, title_font_size=16),
    lighting=False,
)
plotter.add_axes()
plotter.camera_position = [(10, 9.5, -43), (87.0, 73.5, 123.0), (-0.5, -0.7, 0.5)]
plotter.show()

The total flow rate is calculated using the
pyvista.DataSetFilters.integrate_data() filter. Note that the data
is a pyvista.UnstructuredGrid object with only 1 point and 1 cell.
integrated_data = inlet_surface.integrate_data()
integrated_data
Each array in integrated_data stores the integrated data.
integrated_data['normal_velocity']
pyvista_ndarray([25.79937191])
An additional Area or Volume array is added.
print(f'Original arrays: {inlet_surface.array_names}')
new_arrays = [name for name in integrated_data.array_names if name not in inlet_surface.array_names]
print(f'New arrays      : {new_arrays}')
Original arrays: ['normal_velocity', 'node_value', 'simerr_type', 'density', 'velocity', 'shearstress']
New arrays      : ['Area']
Display the total flow rate, area of inlet surface, and average velocity.
total_flow_rate = integrated_data['normal_velocity'][0]
area = integrated_data['Area'][0]
average_velocity = total_flow_rate / area
print(f'Total flow rate : {total_flow_rate:.1f}')
print(f'Area            : {area:.0f}')
print(f'Average velocity: {average_velocity:.3f}')
Total flow rate : 25.8
Area            : 265
Average velocity: 0.097
Volume Integration#
You can also integrate over a volume. Here, we effectively sum the cell and point data across the entire volume. You can use this to compute mean values by dividing by the volume of the dataset.
Note that the calculated volume is the same as pyvista.DataSet.volume.
Also note that the center of the dataset is the “point” of the integrated volume.
integrated_volume = dataset.integrate_data()
center = integrated_volume.points[0]
volume = integrated_volume['Volume'][0]
mean_density = integrated_volume['density'][0] / volume
mean_velocity = integrated_volume['velocity'][0] / volume

print(f'Center          : {center}')
print(f'Volume          : {volume:.0f}')
print(f'Mean density    : {mean_density:.4f}')
print(f'Mean velocity   : {mean_velocity}')
Center          : [ 90.54132  78.15124 116.79401]
Volume          : 39353
Mean density    : 0.3361
Mean velocity   : [-0.00754452  0.012869   -0.11734917]
Total running time of the script: (0 minutes 0.655 seconds)