Note
Go to the end to download the full example code.
Legends and glyphs#
Using custom legends and glyphs within PyVista.
import pyvista as pv
from pyvista import examples
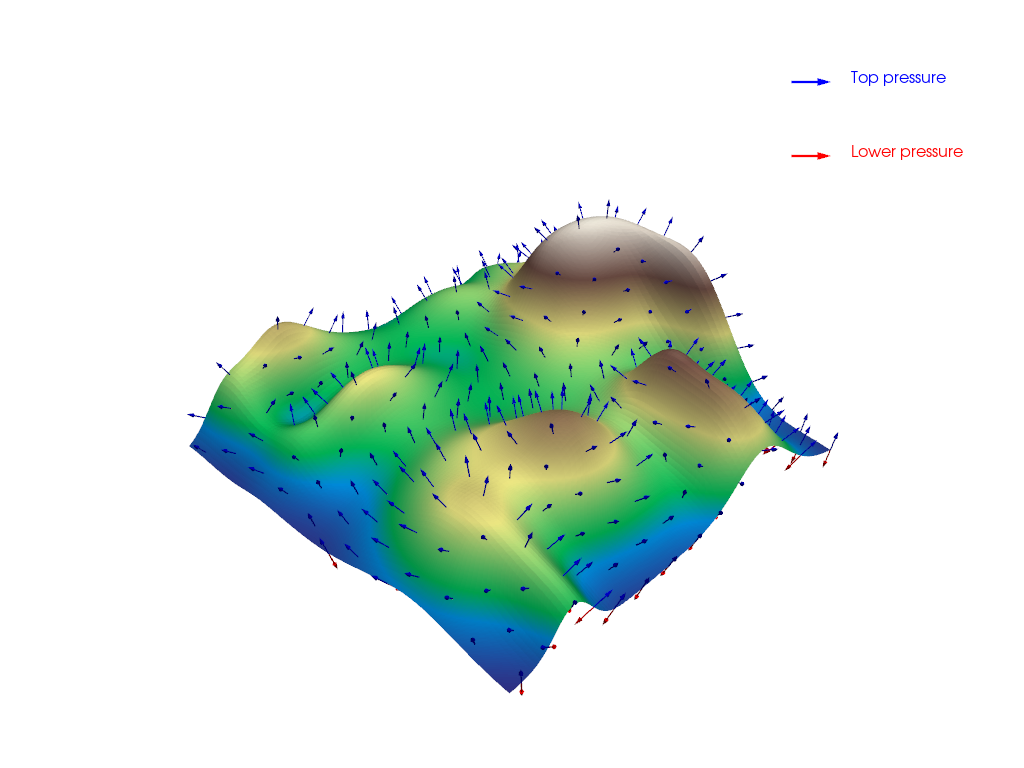
Default legend for glyphs#
The method add_legend() is able to retrieve and use
the glyphs for each plot.
pl = pv.Plotter()

# Loading mesh
mesh = examples.load_random_hills()

# Adding another set of glyphs with opposite value.
mesh['NormalInversed'] = -1 * mesh['Normals'].copy()

# Generating glyph meshes
arrows = mesh.glyph(scale='Normals', orient='Normals', tolerance=0.05)
pl.add_mesh(arrows, color='blue', label='Top pressure')

arrows_inversed = mesh.glyph(
    scale='NormalInversed', orient='NormalInversed', tolerance=0.05
)
pl.add_mesh(arrows_inversed, color='red', label='Lower pressure')

# Adding surface mesh
pl.add_mesh(mesh, scalars='Elevation', cmap='terrain', show_scalar_bar=False)

# Add default legend
pl.add_legend()

# Plot
pl.show()
Using custom legends#
You can use specific labels with add_legend()
pl = pv.Plotter()

# Adding glyph meshes
pl.add_mesh(arrows, color='blue', label='Top pressure')
pl.add_mesh(arrows_inversed, color='red', label='Lower pressure')

# Adding surface mesh
pl.add_mesh(mesh, scalars='Elevation', cmap='terrain', show_scalar_bar=False)

# adding legend
legend = ['New top pressure', 'New lower pressure']

# You can
pl.add_legend(legend)

# In this case, the default values are used, not the ones from the
# :func:`~pyvista.Plotter.add_mesh`.

pl.show()

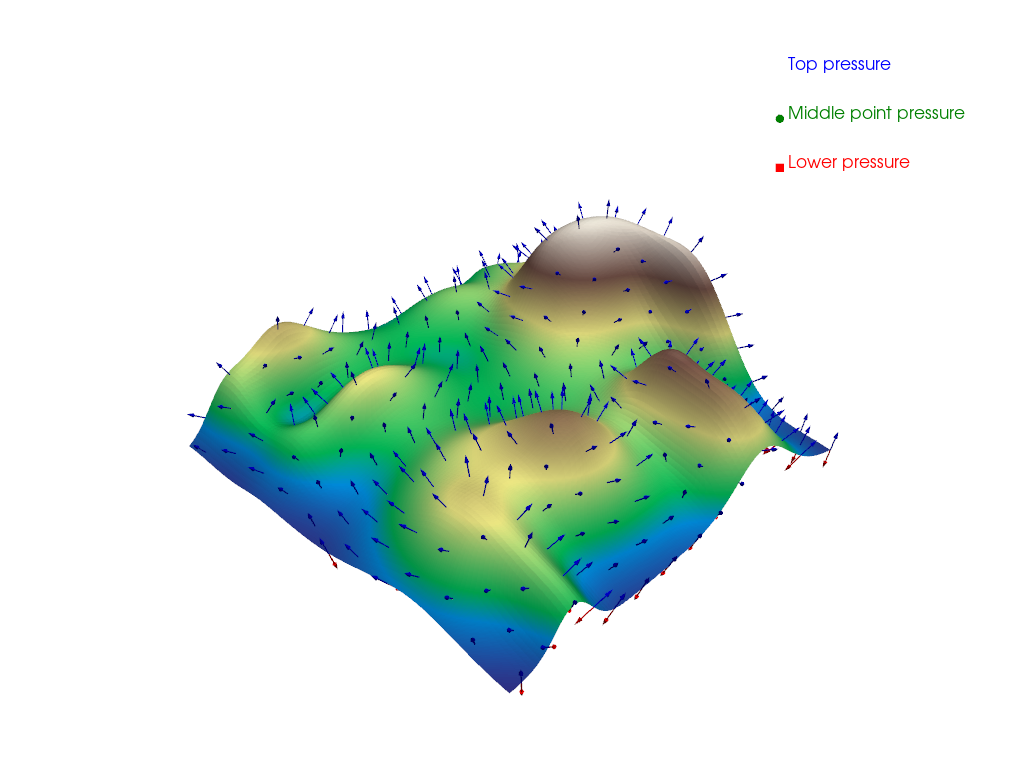
Using custom legend and glyphs#
You can use specific labels or glyphs even if they have been specified before.
pl = pv.Plotter()

# Adding glyph meshes
pl.add_mesh(arrows, color='blue', label='Top pressure')
pl.add_mesh(arrows_inversed, color='red', label='Lower pressure')

# Adding surface mesh
pl.add_mesh(mesh, scalars='Elevation', cmap='terrain', show_scalar_bar=False)

# You can use custom glyphs even if they don't match the plot.
# You can use either ``list`` or ``dict`` for passing the data.
legend = [
    ['Top pressure', 'blue'],  # no custom glyph
    ['Middle point pressure', 'green', 'circle'],  # Using a defaults glyph
    {'label': 'Lower pressure', 'color': 'red', 'face': pv.Box()},
]

# You can
pl.add_legend(legend)

# Plot
pl.show()
Total running time of the script: (0 minutes 1.419 seconds)
