Note
Go to the end to download the full example code.
Multi-Window Plot#
Subplotting: having multiple scenes in a single window
from __future__ import annotations

import pyvista as pv
from pyvista import examples
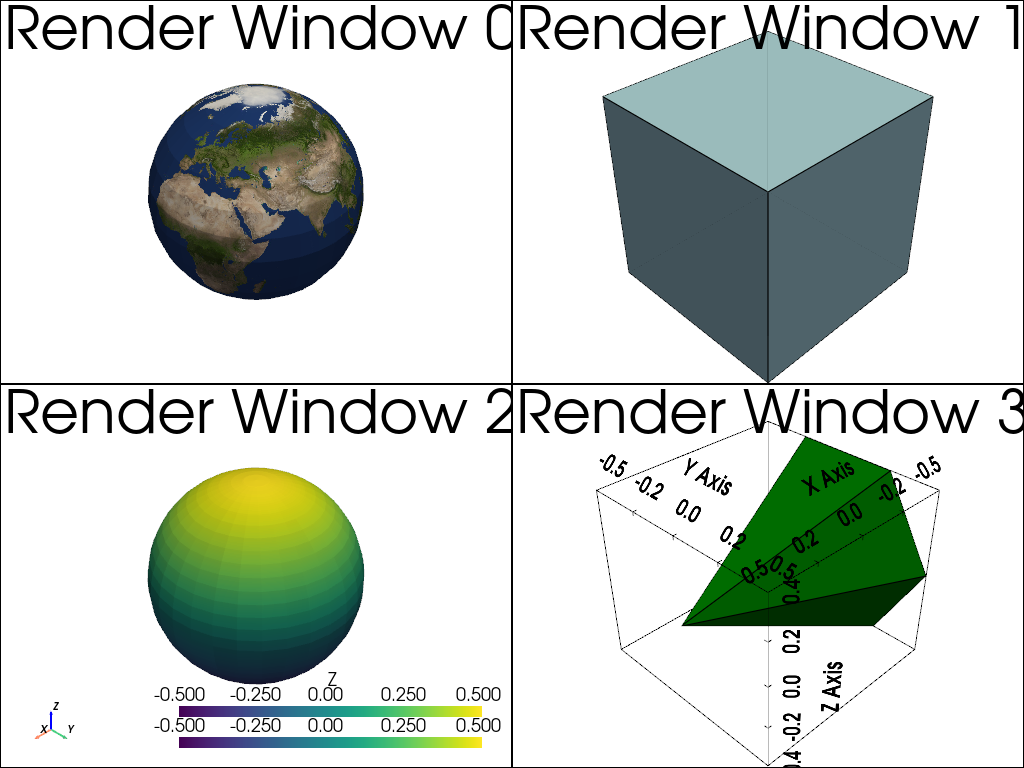
This example shows how to create a multi-window plotter by specifying the
shape parameter. The window generated is a two by two window by setting
shape=(2, 2). Use the pyvista.Plotter.subplot() method to
select the subplot you wish to be the active subplot.
plotter = pv.Plotter(shape=(2, 2))

plotter.subplot(0, 0)
plotter.add_text('Render Window 0', font_size=30)
globe = examples.load_globe()
texture = examples.load_globe_texture()
plotter.add_mesh(globe, texture=texture)

plotter.subplot(0, 1)
plotter.add_text('Render Window 1', font_size=30)
plotter.add_mesh(pv.Cube(), show_edges=True, color='lightblue')

plotter.subplot(1, 0)
plotter.add_text('Render Window 2', font_size=30)
sphere = pv.Sphere()
plotter.add_mesh(sphere, scalars=sphere.points[:, 2])
plotter.add_scalar_bar('Z')
# plotter.add_axes()
plotter.add_axes(interactive=True)

plotter.subplot(1, 1)
plotter.add_text('Render Window 3', font_size=30)
plotter.add_mesh(pv.Cone(), color='g', show_edges=True)
plotter.show_bounds(all_edges=True)

# Display the window
plotter.show()
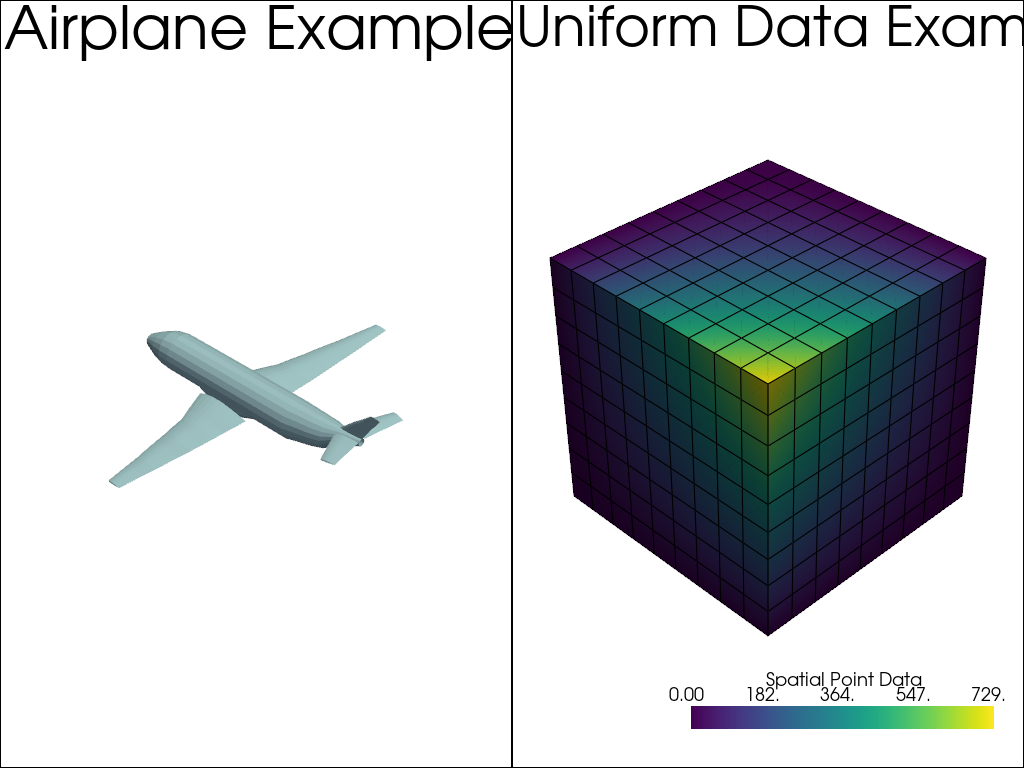
plotter = pv.Plotter(shape=(1, 2))

# Note that the (0, 0) location is active by default
# load and plot an airplane on the left half of the screen
plotter.add_text('Airplane Example\n', font_size=30)
plotter.add_mesh(examples.load_airplane(), show_edges=False)

# load and plot the uniform data example on the right-hand side
plotter.subplot(0, 1)
plotter.add_text('Uniform Data Example\n', font_size=30)
plotter.add_mesh(examples.load_uniform(), show_edges=True)

# Display the window
plotter.show()
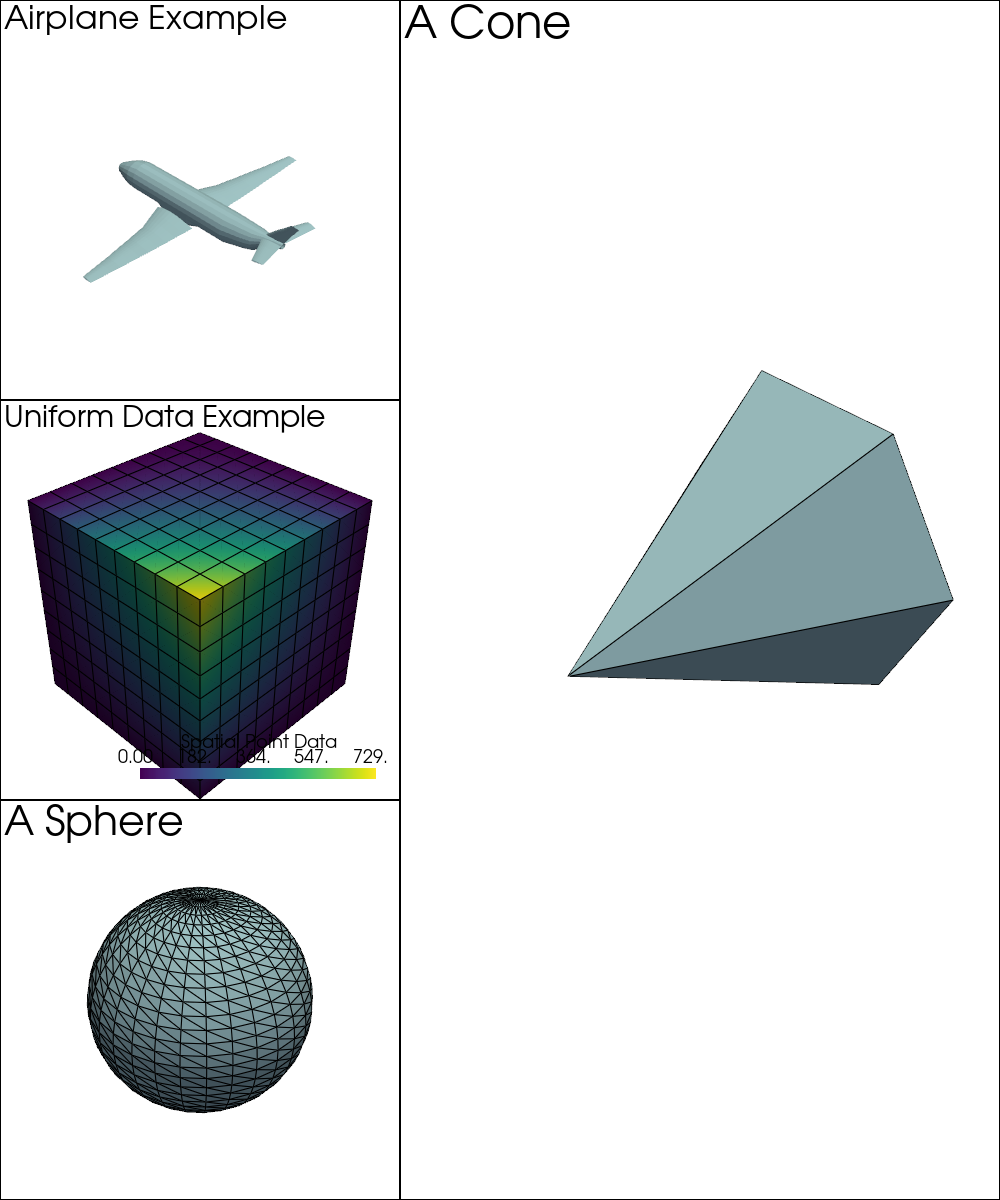
Split the rendering window in half and subdivide it in a nr. of vertical or horizontal subplots.
# This defines the position of the vertical/horizontal splitting, in this
# case 40% of the vertical/horizontal dimension of the window
pv.global_theme.multi_rendering_splitting_position = 0.40

# shape="3|1" means 3 plots on the left and 1 on the right,
# shape="4/2" means 4 plots on top of 2 at bottom.
plotter = pv.Plotter(shape='3|1', window_size=(1000, 1200))

plotter.subplot(0)
plotter.add_text('Airplane Example')
plotter.add_mesh(examples.load_airplane(), show_edges=False)

# load and plot the uniform data example on the right-hand side
plotter.subplot(1)
plotter.add_text('Uniform Data Example')
plotter.add_mesh(examples.load_uniform(), show_edges=True)

plotter.subplot(2)
plotter.add_text('A Sphere')
plotter.add_mesh(pv.Sphere(), show_edges=True)

plotter.subplot(3)
plotter.add_text('A Cone')
plotter.add_mesh(pv.Cone(), show_edges=True)

# Display the window
plotter.show()
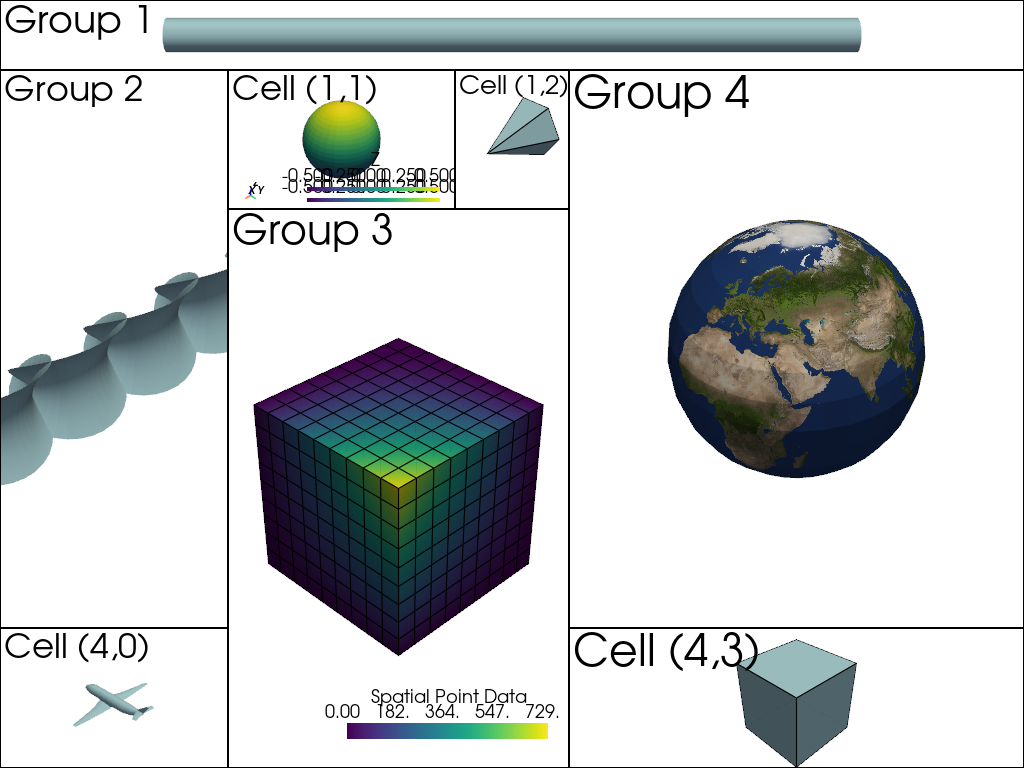
To get full flexibility over the layout grid, you can define the relative
weighting of rows and columns and register groups that can span over multiple
rows and columns. A group is defined through a tuple (rows,cols) of row
and column indices or slices. The group always spans from the smallest to the
largest (row or column) id that is passed through the list or slice.
# numpy is imported for a more convenient slice notation through np.s_
import numpy as np

shape = (5, 4)  # 5 by 4 grid
# First row is half the size and fourth row is double the size of the other rows
row_weights = [0.5, 1, 1, 2, 1]
# Third column is half the size and fourth column is double size of the other columns
col_weights = [1, 1, 0.5, 2]
groups = [
    (0, np.s_[:]),  # First group spans over all columns of the first row (0)
    ([1, 3], 0),  # Second group spans over row 1-3 of the first column (0)
    (np.s_[2:], [1, 2]),  # Third group spans over rows 2-4 and columns 1-2
    (slice(1, -1), 3),  # Fourth group spans over rows 1-3 of the last column (3)
]

plotter = pv.Plotter(shape=shape, row_weights=row_weights, col_weights=col_weights, groups=groups)

# A grouped subplot can be activated through any of its composing cells using
# the subplot() method.

# Access all subplots and groups and plot something:
plotter.subplot(0, 0)
plotter.add_text('Group 1')
plotter.add_mesh(pv.Cylinder(direction=[0, 1, 0], height=20))
plotter.view_yz()
plotter.camera.zoom(10)

plotter.subplot(2, 0)
plotter.add_text('Group 2')
plotter.add_mesh(pv.ParametricCatalanMinimal(), show_edges=False, color='lightblue')
plotter.view_isometric()
plotter.camera.zoom(2)

plotter.subplot(2, 1)
plotter.add_text('Group 3')
plotter.add_mesh(examples.load_uniform(), show_edges=True)

plotter.subplot(1, 3)
plotter.add_text('Group 4')
globe = examples.load_globe()
texture = examples.load_globe_texture()
plotter.add_mesh(globe, texture=texture)

plotter.subplot(1, 1)
plotter.add_text('Cell (1,1)')
sphere = pv.Sphere()
plotter.add_mesh(sphere, scalars=sphere.points[:, 2])
plotter.add_scalar_bar('Z')
plotter.add_axes(interactive=True)

plotter.subplot(1, 2)
plotter.add_text('Cell (1,2)')
plotter.add_mesh(pv.Cone(), show_edges=True)

plotter.subplot(4, 0)
plotter.add_text('Cell (4,0)')
plotter.add_mesh(examples.load_airplane(), show_edges=False)

plotter.subplot(4, 3)
plotter.add_text('Cell (4,3)')
plotter.add_mesh(pv.Cube(), show_edges=True, color='lightblue')

# Display the window
plotter.show()
Total running time of the script: (0 minutes 2.621 seconds)