Note
Go to the end to download the full example code.
Sharing Scalar Bars#
Use subplot() and show to share scalar bars
among plotted arrays or use a unique scalar bar for each plotted array.
import pyvista as pv
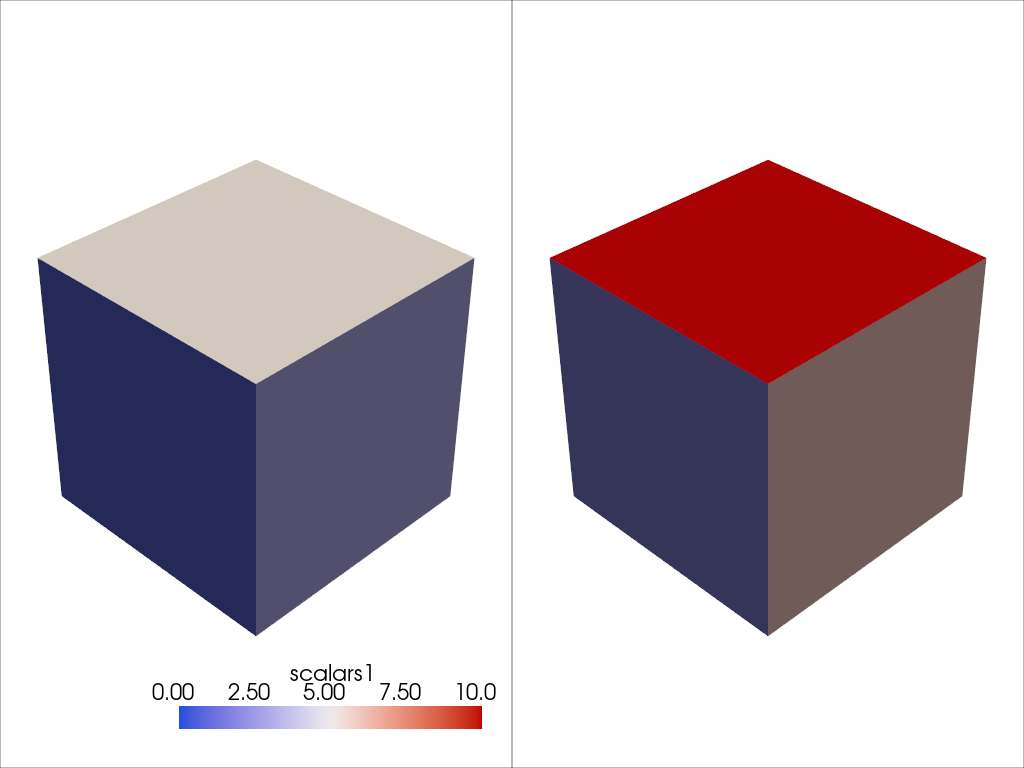
By default, a single scalar bar is used for all plotted scalars with the same name:
# Create two cube meshes containing the scalar array scalars1
cube = pv.Cube()
cube.cell_data['scalars1'] = range(0, 6, 1)
second_cube = cube.copy()
second_cube.cell_data['scalars1'] = range(0, 12, 2)

# Plot the scalars1 array for each cube - note how there is only one scalar bar
pl = pv.Plotter(shape=(1, 2), border_width=1)
pl.add_mesh(cube, scalars='scalars1', cmap='coolwarm')
pl.subplot(0, 1)
pl.add_mesh(second_cube, scalars='scalars1', cmap='coolwarm')
pl.show()
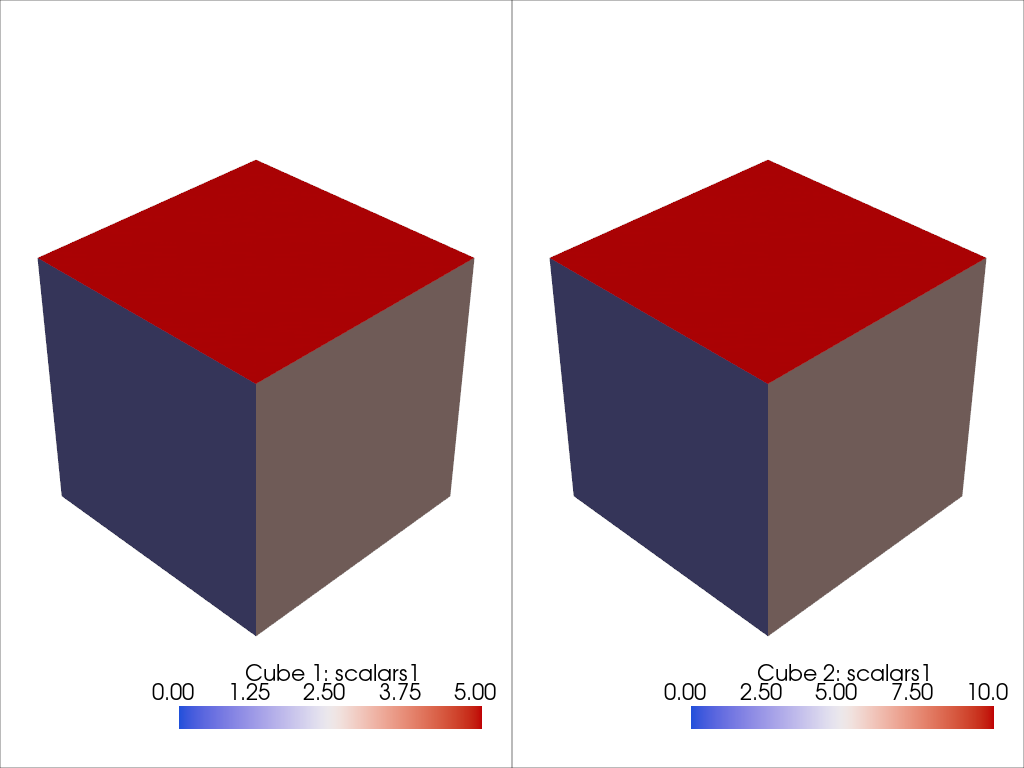
To use a separate scalar bar for each plotted scalar, set the scalar bar title to a unique string for each plot:
pl = pv.Plotter(shape=(1, 2), border_width=1)
pl.add_mesh(
    cube,
    scalars='scalars1',
    cmap='coolwarm',
    scalar_bar_args={'title': 'Cube 1: scalars1'},
)  # Unique title
pl.subplot(0, 1)
pl.add_mesh(
    second_cube,
    scalars='scalars1',
    cmap='coolwarm',
    scalar_bar_args={'title': 'Cube 2: scalars1'},
)  # Unique title
pl.show()
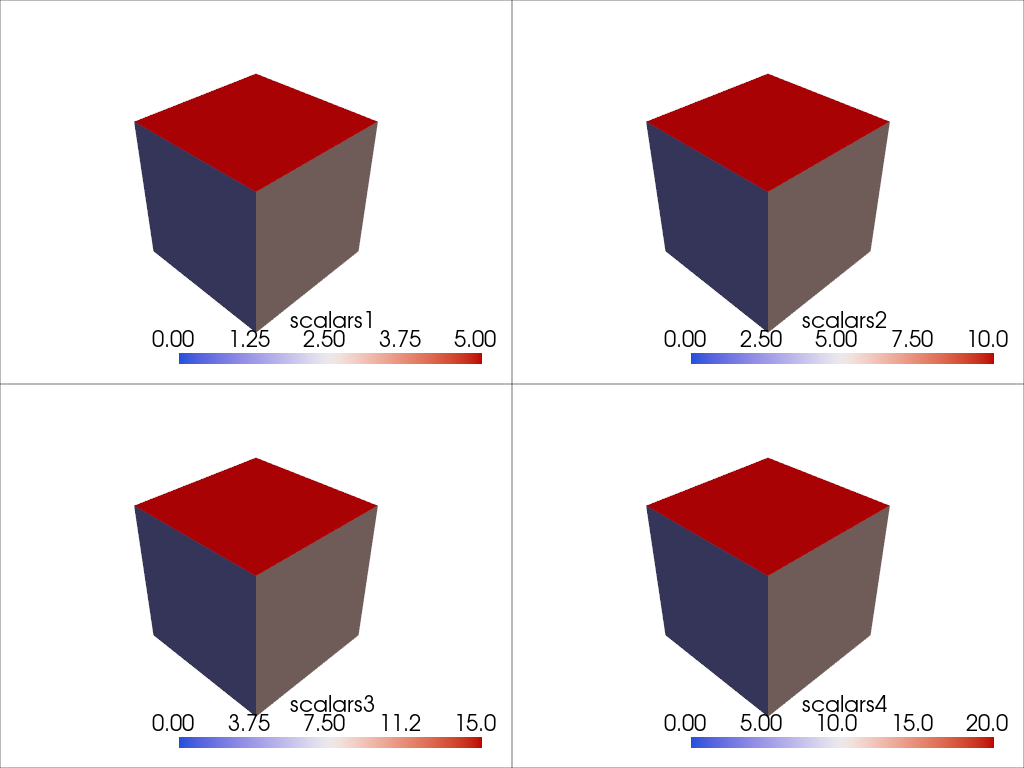
By default, a unique scalar bar is used for all plotted scalars with unique names:
# Create a cube mesh with four scalar arrays
cube = pv.Cube()
cube.cell_data['scalars1'] = range(0, 6, 1)
cube.cell_data['scalars2'] = range(0, 12, 2)
cube.cell_data['scalars3'] = range(0, 18, 3)
cube.cell_data['scalars4'] = range(0, 24, 4)

# Plot the four scalar arrays - note how there is one scalar bar for each plotted
# scalar. A shallow copy of cube is made when plotting each scalar array since
# a mesh can have only one active scalar
pl = pv.Plotter(shape=(2, 2), border_width=1)
pl.add_mesh(cube, scalars='scalars1', cmap='coolwarm')
pl.camera.zoom(0.75)
pl.subplot(0, 1)
pl.add_mesh(cube.copy(deep=False), scalars='scalars2', cmap='coolwarm')
pl.camera.zoom(0.75)
pl.subplot(1, 0)
pl.add_mesh(cube.copy(deep=False), scalars='scalars3', cmap='coolwarm')
pl.camera.zoom(0.75)
pl.subplot(1, 1)
pl.add_mesh(cube.copy(deep=False), scalars='scalars4', cmap='coolwarm')
pl.camera.zoom(0.75)
pl.show()
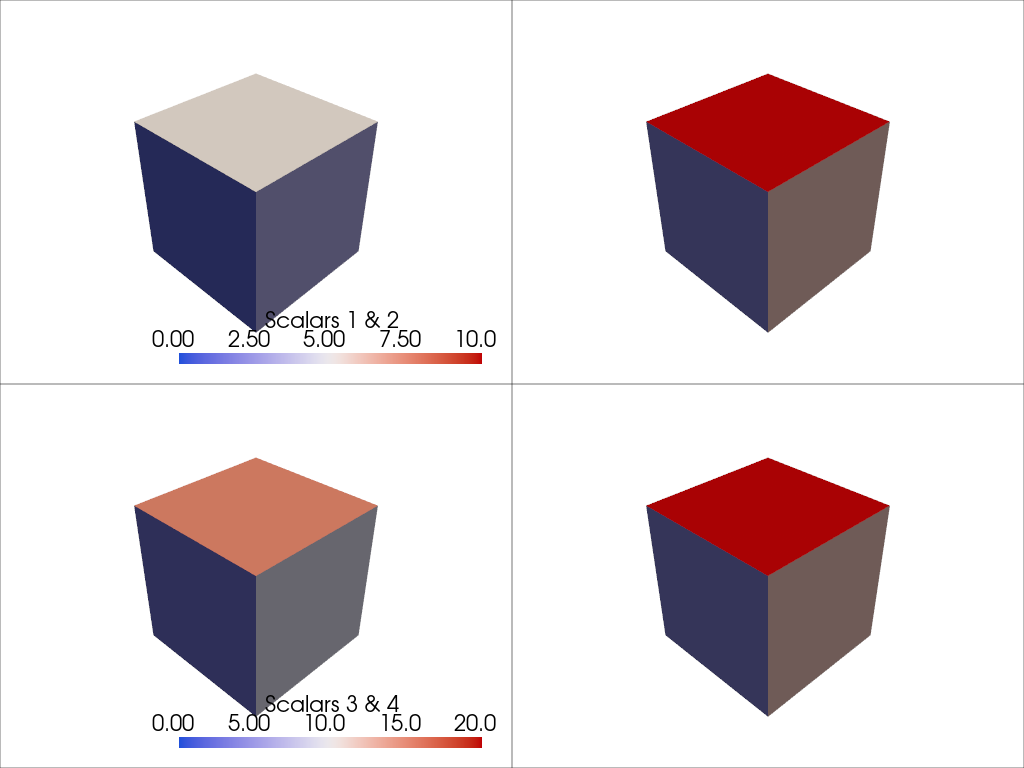
To share a scalar bar among different subplots, use a common scalar bar title among those subplots:
# Plot the four scalar arrays - use one scalar bar for each row
pl = pv.Plotter(shape=(2, 2), border_width=1)
pl.add_mesh(
    cube, scalars='scalars1', cmap='coolwarm', scalar_bar_args={'title': 'Scalars 1 & 2'}
)
pl.camera.zoom(0.75)
pl.subplot(0, 1)
pl.add_mesh(
    cube.copy(deep=False),
    scalars='scalars2',
    cmap='coolwarm',
    scalar_bar_args={'title': 'Scalars 1 & 2'},
)
pl.camera.zoom(0.75)
pl.subplot(1, 0)
pl.add_mesh(
    cube.copy(deep=False),
    scalars='scalars3',
    cmap='coolwarm',
    scalar_bar_args={'title': 'Scalars 3 & 4'},
)
pl.camera.zoom(0.75)
pl.subplot(1, 1)
pl.add_mesh(
    cube.copy(deep=False),
    scalars='scalars4',
    cmap='coolwarm',
    scalar_bar_args={'title': 'Scalars 3 & 4'},
)
pl.camera.zoom(0.75)
pl.show()
Total running time of the script: (0 minutes 1.084 seconds)
