plot_arrows#
- plot_arrows(
- cent: VectorLikeFloat | MatrixLikeFloat,
- direction: VectorLikeFloat | MatrixLikeFloat,
- **kwargs: Any,
Plot arrows as vectors.
- Parameters:
- cent
VectorLikeFloat|MatrixLikeFloat Accepts a single 3d point or array of 3d points.
- direction
VectorLikeFloat|MatrixLikeFloat Accepts a single 3d point or array of 3d vectors. Must contain the same number of items as
cent.- **kwargs
dict, optional See
pyvista.plot().
- cent
- Returns:
tupleSee the returns of
pyvista.plot().
Examples#
Download Python source code | Download Jupyter notebook
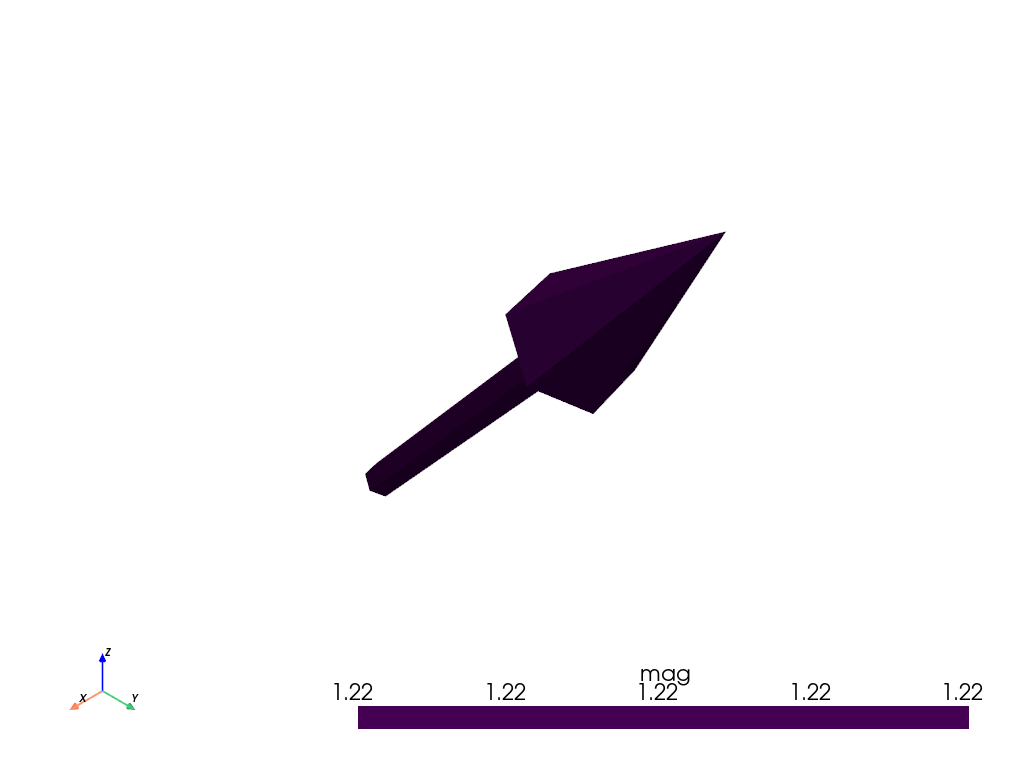
Plot a single random arrow.
>>> import numpy as np
>>> import pyvista as pv
>>> rng = np.random.default_rng(seed=0)
>>> cent = rng.random(3)
>>> direction = rng.random(3)
>>> pv.plot_arrows(cent, direction)
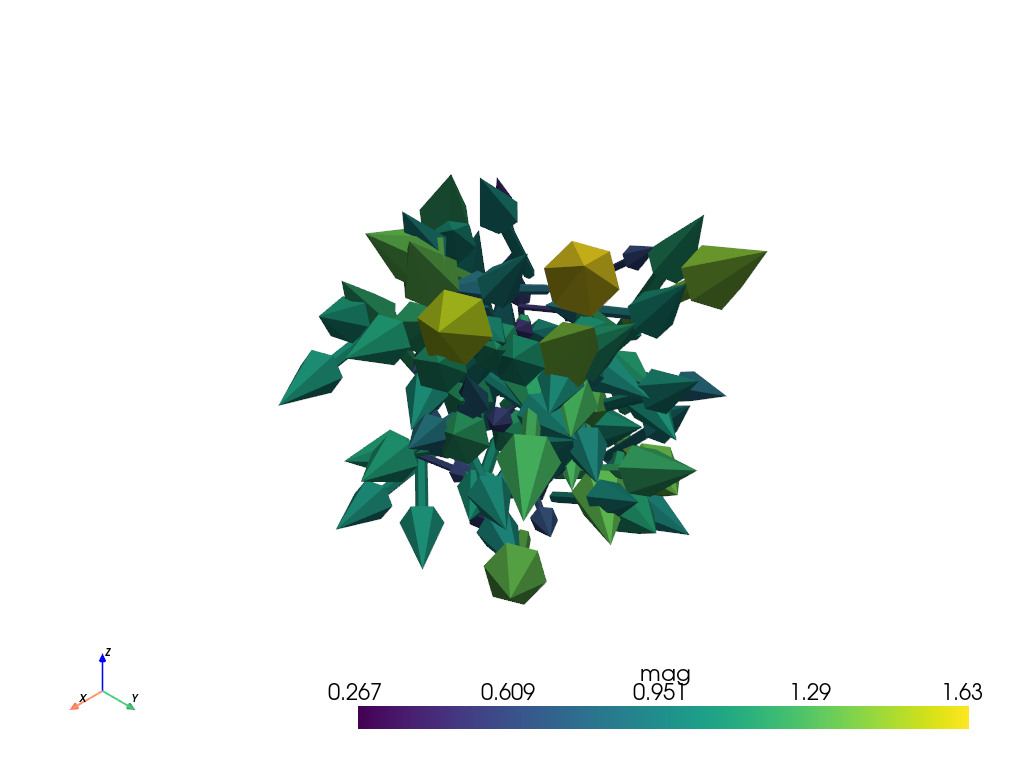
Plot 100 random arrows.
>>> import numpy as np
>>> import pyvista as pv
>>> cent = rng.random((100, 3))
>>> direction = rng.random((100, 3))
>>> pv.plot_arrows(cent, direction)