plot_compare#
- plot_compare(
- datasets: Sequence[PlottableType] | Mapping[str, PlottableType],
- *,
- labels: Iterable[str] | None = auto,
- label_size: float | Literal['best_fit', 'uniform'] | None = None,
- label_position: TextPositionOptions | None = None,
- label_kwargs: dict[str, Any] | None = None,
- reference_mesh: DataSet | MultiBlock[Any] | PartitionedDataSet | None = None,
- reference_kwargs: dict[str, Any] | None = None,
- volume: bool = False,
- shape: Sequence[int] | str | None = None,
- normalize: bool = False,
- link: bool | None = None,
- cpos: CameraPositionOptions | None = None,
- zoom: str | float | None = None,
- show_axes: bool | None = None,
- show_bounds: bool = False,
- background: ColorLike | None = None,
- anti_aliasing: Literal['ssaa', 'msaa', 'fxaa'] | bool | None = None,
- eye_dome_lighting: bool = False,
- parallel_projection: bool = False,
- ssao: bool = False,
- off_screen: bool | None = None,
- notebook: bool | None = None,
- window_size: list[int] | None = None,
- border: BorderOptions | None = None,
- border_color: ColorLike | None = None,
- border_width: float | None = None,
- theme: Theme | ThemeOptions | str | None = None,
- screenshot: str | bool | None = None,
- full_screen: bool | None = None,
- interactive: bool = True,
- return_img: bool = False,
- return_cpos: bool = False,
- return_viewer: bool = False,
- jupyter_backend: JupyterBackendOptions | None = None,
- jupyter_kwargs: dict[str, Any] | None = None,
- before_close_callback: Callable[[Plotter], None] | None = None,
- **kwargs: Any,
Plot a grid comparison of any number of data objects.
Note
This function is also available via command-line interface. See pyvista compare for details.
Each data object is shown in its own subplot. By default, the subplots are arranged in a compact grid which is never taller than it is wide, for example,
(1, 2)for two datasets,(1, 3)for three,(2, 2)for four, and(2, 3)for five or six. Any leftover subplots are left empty. Useshapeto control the layout explicitly.Added in version 0.49.
- Parameters:
- datasets
Sequence[PlottableType] |Mapping[str,PlottableType] The data objects to compare, each of which is anything
add_mesh()can draw. At least two datasets are required. If a mapping or aMultiBlockis given, its keys are used as the defaultlabels.- labels
Iterable[str] |None, optional The labels to display for each data object. Must have the same length as
datasets. By default, the keys ofdatasetsare used when it is a mapping or aMultiBlock, and the labels'A','B','C', and so on are generated otherwise. Set toNoneto disable labels.If the input has keys and
labelsare provided, the providedlabelstake precedence and are used instead of its keys.- label_size
float|str, optional The size of the
labels, either as a literal font size integer or as a string denoting how to work one out. A font size is used as given, and the labels will have the same constant size regardless of the window size of the plot. The label sizes which are worked out are:'best_fit': draw each label as large as it fits in its own subplot, up to the font size of the theme. Labels of different lengths, and labels in subplots of different sizes, are drawn at different sizes.'uniform': draw every label at the size of the one which has to be smallest to fit, so that they are all the same size no matter how long they are or which subplot they are in.
By default,
'uniform'is used whenshapeis a grid and all subplots have the same width; ‘best_fit’` is used otherwise whenshapeis a string descriptor and the subplots have different widths. A label too long to fit at a readable size has its middle elided, for example,this is a very long labelmay becomethis is...g label.With the
'best_fit'and'uniform'options, the actual font size is dynamically re-computed whenever the window is resized. Has no effect whenlabelsisNone.- label_position
str, optional Where in its subplot to draw each of the
labels:'upper_left','upper_right','lower_left','lower_right','upper_edge','lower_edge','left_edge'or'right_edge'.Defaults to
'upper_left'. Has no effect whenlabelsisNone.- label_kwargs
dict, optional Additional keyword arguments for the
Textactor which draws each of thelabels, for example,{'color': 'red'}. Takes whatadd_text()takes. Has no effect whenlabelsisNone.- reference_mesh
DataSet|MultiBlock, optional A mesh to draw in every subplot to give the comparison a common frame of reference, for example, an outline of the dataset the compared results are derived from. The same mesh is drawn in each subplot, so it does not follow the bounds of the individual datasets. See the warning in
normalizebefore using both.- reference_kwargs
dict, optional Additional keyword arguments to pass to the
add_mesh()method used to show thereference_mesh. Defaults to{'color': 'k'}.- volumebool, default:
False Use the
Plotter.add_volume()method for volume rendering.- shape
Sequence[int] |str, optional The shape of the subplot layout, in any form accepted by
Plotter. Either a(n_rows, n_cols)sequence, or a string descriptor such as'3|1'for three subplots on the left and one on the right, or'4/2'for four on top and two on the bottom. Must define at least as many subplots as there are datasets. By default, the compact grid described above in the summary is used.- normalizebool, default:
False Resize every dataset to a diagonal
lengthof one, centered on the origin, so that datasets of very different sizes are compared shape by shape. The datasets given are left as they are, and the resized copies of them are what is drawn, as is areference_mesh.Normalized datasets are all the same size and in the same place, so they are linked by default, which datasets of very different sizes are not.
Warning
A
reference_meshsays much less about normalized datasets. Each of them is resized by a factor of its own, so the one mesh drawn in every subplot no longer relates them to each other, and is drawn at the size of each rather than around it.- linkbool, optional
If
True, link the views of the subplots so that they share a single camera. The shared camera is fit to the bounds of every dataset, so the datasets are shown at a common scale and the framing does not depend on the order they are given in. IfFalse, each subplot keeps its own camera and is fit to its own dataset.By default, the views are linked when every dataset is at least half the size of all of them together, which means they occupy the same space at a comparable scale and one camera suits them all. Datasets which are much smaller than the rest, or which are far apart, are not linked, since a shared camera would leave some of them too small to make out. What each subplot has to fit is the dataset and the
reference_meshtogether when one is given, since the same mesh is drawn alongside every dataset.In every case the camera is only fit when
cposisNoneor a string, since a fully specified camera position is used as given.- cpos
CameraPositionOptions, optional The camera position to use in every subplot, as a list of the position, the focal point and the view up, or as one of the views
camera_positionnames, for example,'xy'or'iso'. A view is fit to the datasets, and a fully specified position is used as it is.- zoom
float|str, optional Camera zoom, applied after the camera is fit to the datasets. Either
'tight'or a float, where a value greater than1is a zoom-in.- show_axesbool, optional
Show the axes orientation widget in every subplot. By default, the
axessetting of the theme is used.- show_boundsbool, default:
False Show the bounds axes in every subplot.
- background
ColorLike, default:pyvista.plotting.themes.Theme.background Color of the background.
- anti_aliasing
Literal[‘ssaa’, ‘msaa’, ‘fxaa’] | bool, optional Enable or disable anti-aliasing. If
True, uses"msaa". If False, disablesanti_aliasing. If a string, should be one of the following:"ssaa"- Super-Sample Anti-Aliasing"msaa"- Multi-Sample Anti-Aliasing"fxaa"- Fast Approximate Anti-Aliasing
Defaults to
pyvista.plotting.themes.Theme.anti_aliasing- eye_dome_lightingbool, optional
Enables eye dome lighting.
- parallel_projectionbool, default:
False Enable parallel projection.
- ssaobool, optional
Enable surface space ambient occlusion (SSAO). See
Plotter.enable_ssao()for more details.- off_screenbool, optional
Plots off screen when
True. Helpful for saving screenshots without a window popping up. Defaults to the global settingpyvista.OFF_SCREEN.- notebookbool, default:
pyvista.plotting.themes.Theme.notebook When
True, the resulting plot is placed inline a jupyter notebook. Assumes a jupyter console is active.- window_size
list[int], default:pyvista.plotting.themes.Theme.window_size Window size in pixels.
- borderbool | ‘interior’ | ‘exterior’, optional
Draw a border around the plotting area.
Truedraws both an outer frame and lines between subplots;Falsedraws neither.'interior'draws only the lines between subplots, and'exterior'only the outer frame. Defaults to'interior'.- border_color
ColorLike, optional Color of the border and/or subplot seams. Defaults to
pyvista.global_theme.border_color. Accepts a string, rgb list, or hex color string. For example:color='white'color='w'color=[1.0, 1.0, 1.0]color='#FFFFFF'
- border_width
float, optional Width of the border and/or subplot seams in pixels, when enabled. Defaults to
pyvista.global_theme.border_width.- theme
pyvista.plotting.themes.Theme|str, optional Plot-specific theme. Accepts a
Themeinstance or a registered theme name (for example,'dark'); seeregistered_themes().- screenshot
str| bool, optional File name or path to save screenshot of the plot, or
Trueto return a screenshot array.- full_screenbool, default:
pyvista.plotting.themes.Theme.full_screen Opens window in full screen. When enabled, ignores
window_size.- interactivebool, default:
pyvista.plotting.themes.Theme.interactive Allows user to pan and move figure.
- return_imgbool, default:
False Returns a NumPy array of the last image rendered.
- return_cposbool, default:
False Return the last camera position from the render window when enabled. Defaults to value in theme settings.
- return_viewerbool, default:
False Return the jupyterlab viewer, scene, or display object when plotting with jupyter notebook.
- jupyter_backend
JupyterBackendOptions, optional Jupyter notebook plotting backend to use. See available documentation at
pyvista.set_jupyter_backend()to see all valid values for this parameter along with a detailed documentation.Defaults to
pyvista.plotting.themes.Theme.jupyter_backend- jupyter_kwargs
dict, optional Keyword arguments for the Jupyter notebook plotting backend. See Customize Trame Toolbar for an example using this keyword.
- before_close_callback
Callable, optional Callback that is called before the plotter is closed. The function takes a single parameter, which is the plotter object before it closes. An example of use is to capture a screenshot after interaction:
def fun(plotter):
    plotter.screenshot('file.png')
- **kwargs
dict, optional Additional keyword arguments to pass to the
add_mesh()method which draws each of thedatasets, or toadd_volume()whenvolumeisTrue. These are the keywordspyvista.plot()takes.Give a keyword a single value to draw every subplot with that value, or a sequence of values to draw each subplot with its own. The length of the sequence must match the number of
datasets.A keyword whose own value is a sequence keeps it, so
clim=[0, 1]is one range for every subplot. Nest the values to vary one of those, as inclim=[[0, 1], [0, 2]].opacityis the exception: a sequence of any other length is one opacity transfer function rather than an error.Changed in version 0.50: A keyword given one value for each of the
datasetsdraws each subplot with its own value.opacityis one opacity for each subplot rather than one transfer function for all of them, unlessvolumeisTrue.
- datasets
- Returns:
- cpos
CameraPosition See the returns of
pyvista.Plotter.show().
- cpos
Examples#
Download Python source code | Download Jupyter notebook
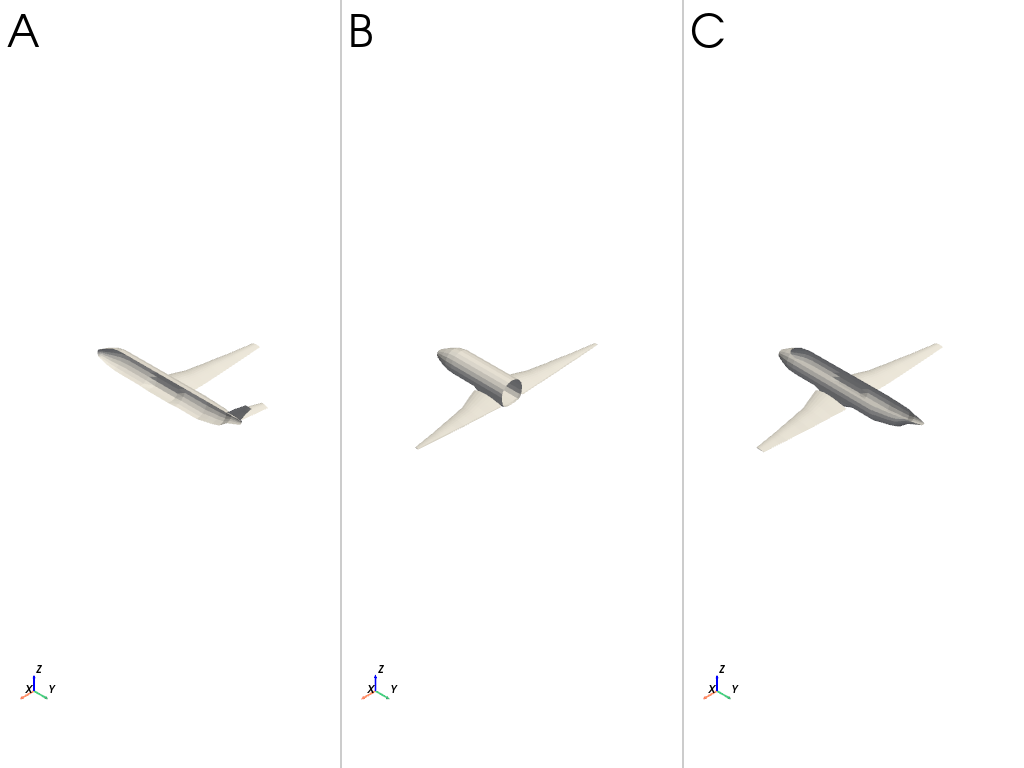
Compare three filtered versions of a dataset.
>>> import pyvista as pv
>>> from pyvista import examples
>>> mesh = examples.load_airplane()
>>> pv.plot_compare(
...     [mesh.clip('x'), mesh.clip('y'), mesh.clip('z')],
...     color='w',
... )
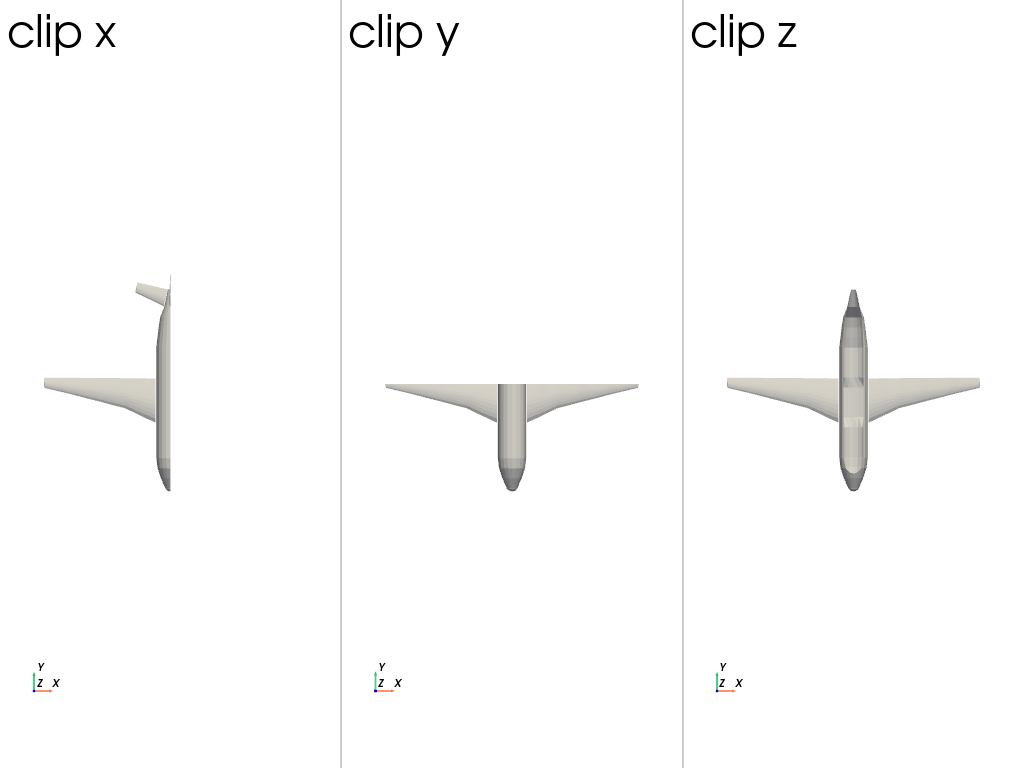
Use a dictionary to label each dataset and set the camera position explicitly.
>>> pv.plot_compare(
...     {
...         'clip x': mesh.clip('x'),
...         'clip y': mesh.clip('y'),
...         'clip z': mesh.clip('z'),
...     },
...     color='w',
...     cpos='xy',
... )
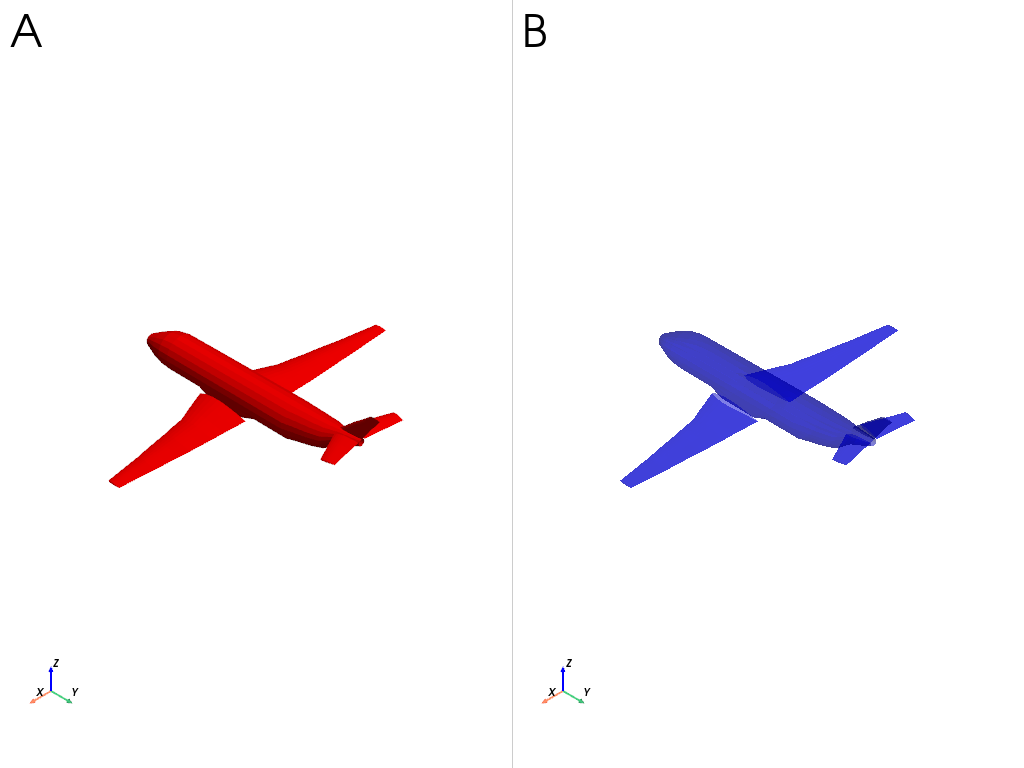
Vary a keyword from one subplot to the next by giving it one value per dataset. Here the same mesh is drawn twice, in two colors and two opacities.
>>> pv.plot_compare(
...     [mesh, mesh],
...     color=['red', 'blue'],
...     opacity=[1.0, 0.5],
... )
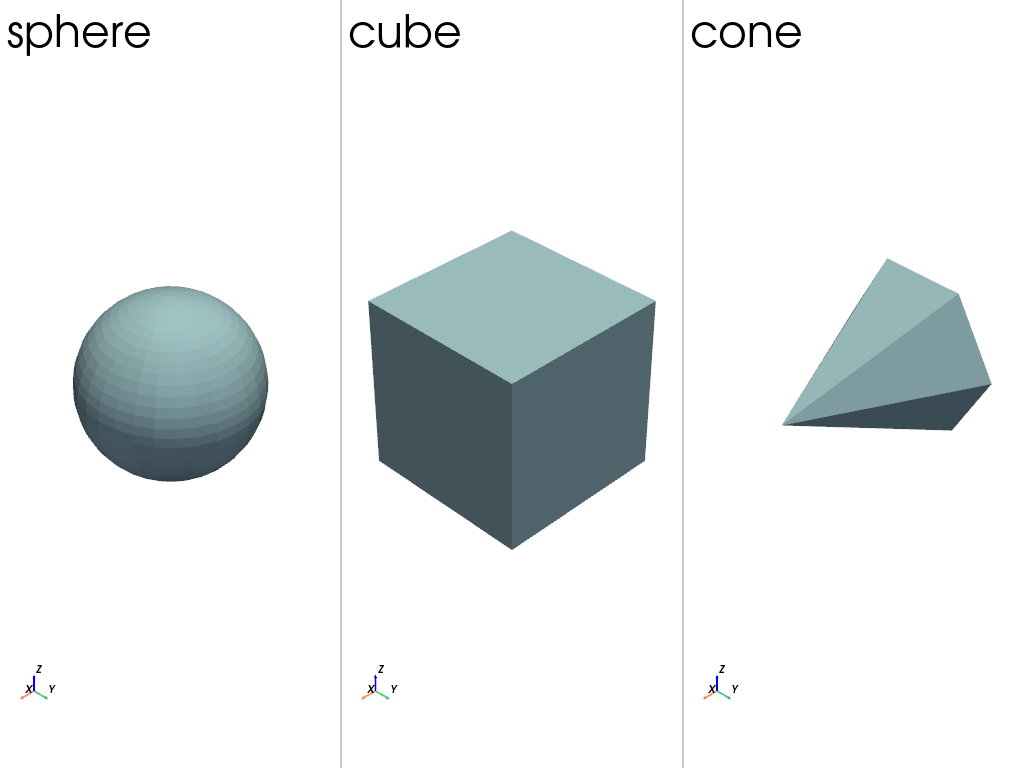
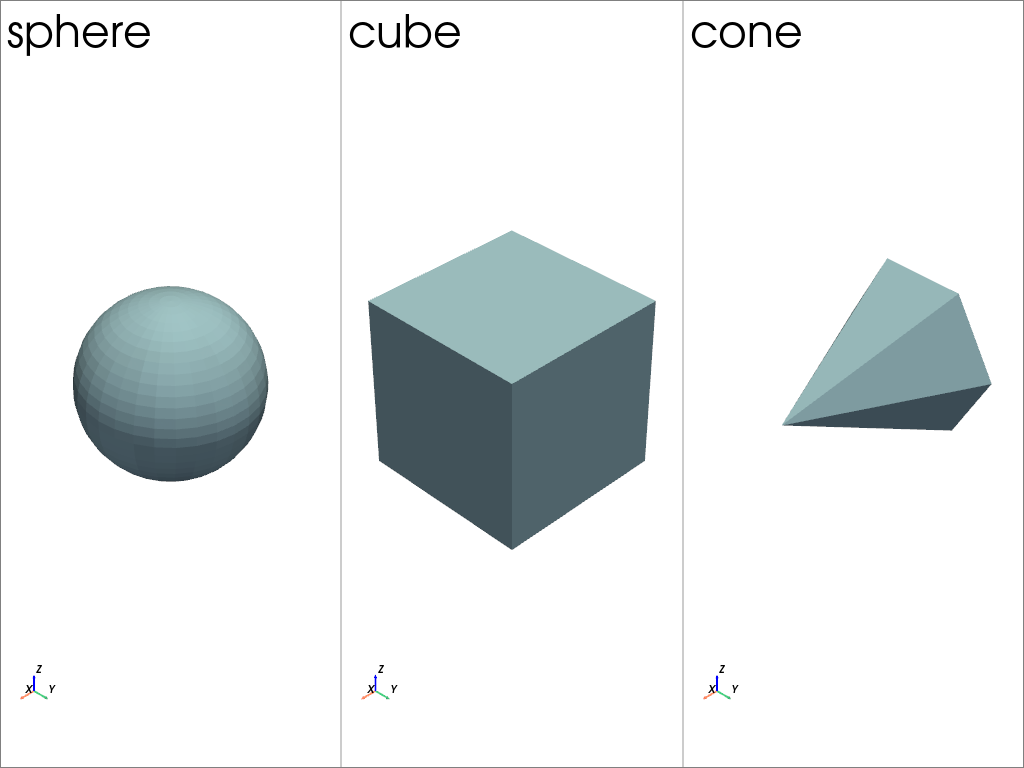
A MultiBlock is compared block-by-block, and its block
names are used as labels.
>>> blocks = pv.MultiBlock(
...     {'sphere': pv.Sphere(), 'cube': pv.Cube(), 'cone': pv.Cone()}
... )
>>> pv.plot_compare(blocks)
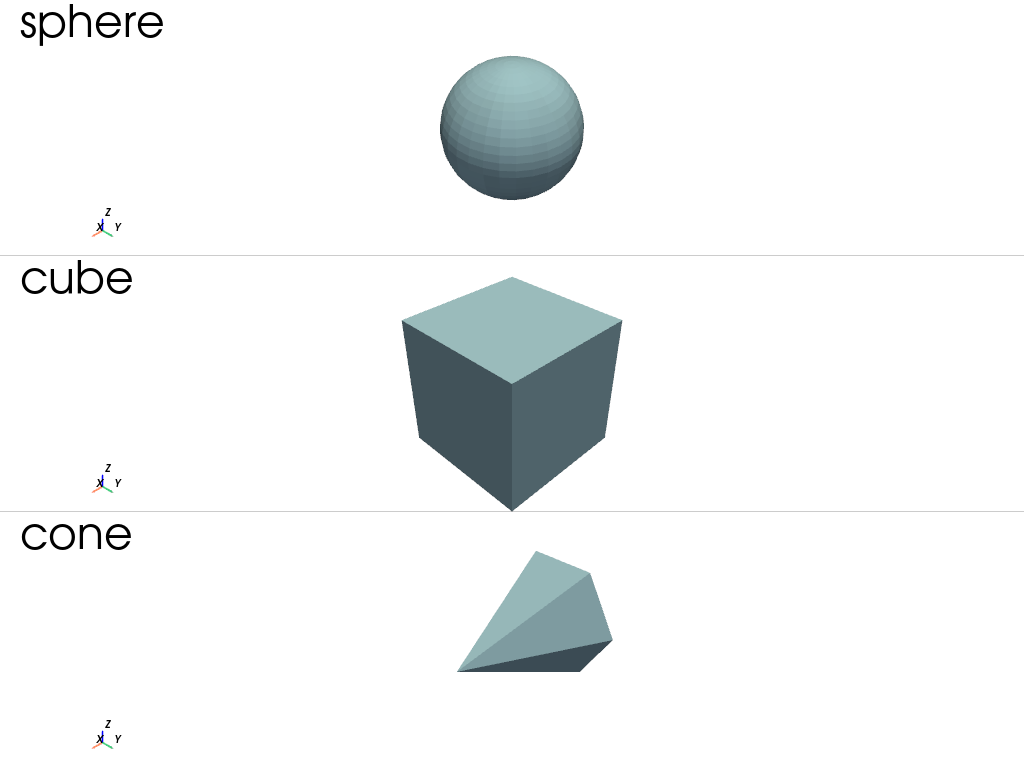
Control the shape of the plot explicitly.
>>> pv.plot_compare(blocks, shape=(3, 1))
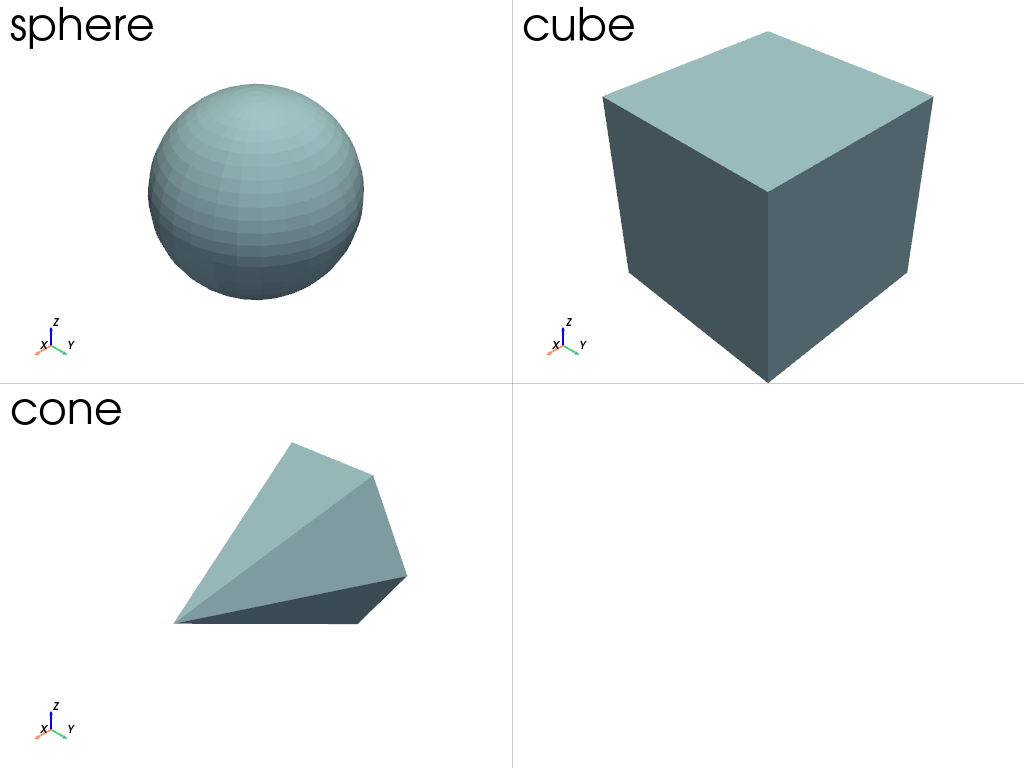
A shape with more subplots than datasets shows blank plots.
>>> pv.plot_compare(blocks, shape=(2, 2))
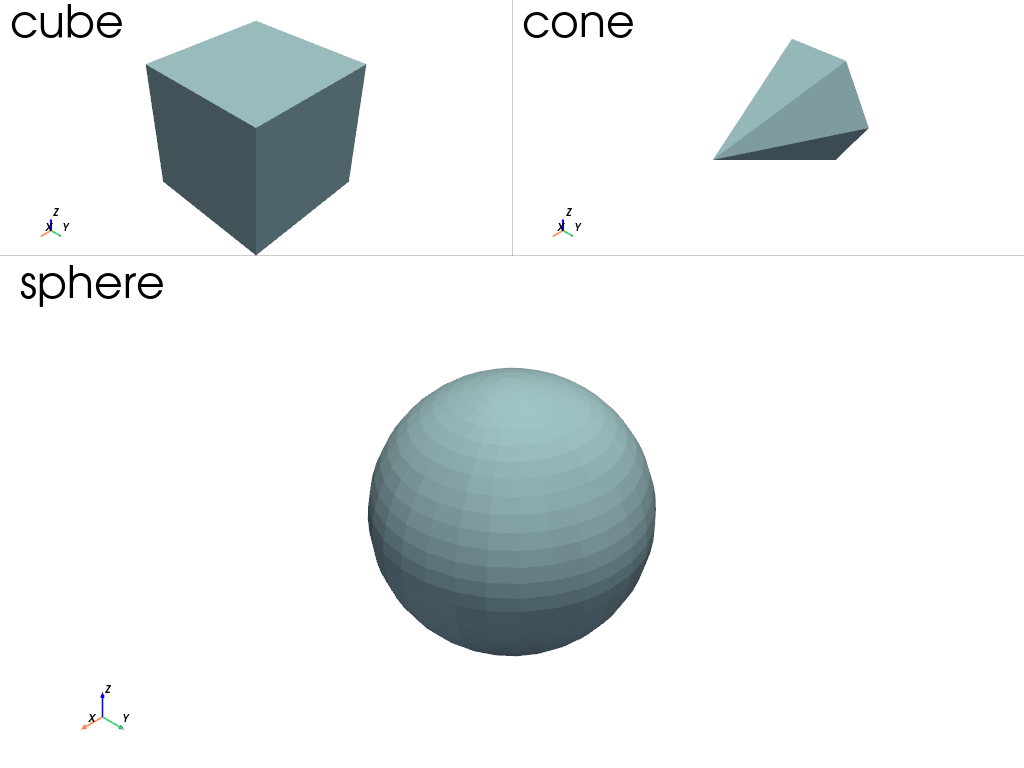
Use a string descriptor to plot one on top, two on the bottom.
>>> pv.plot_compare(blocks, shape='2/1')
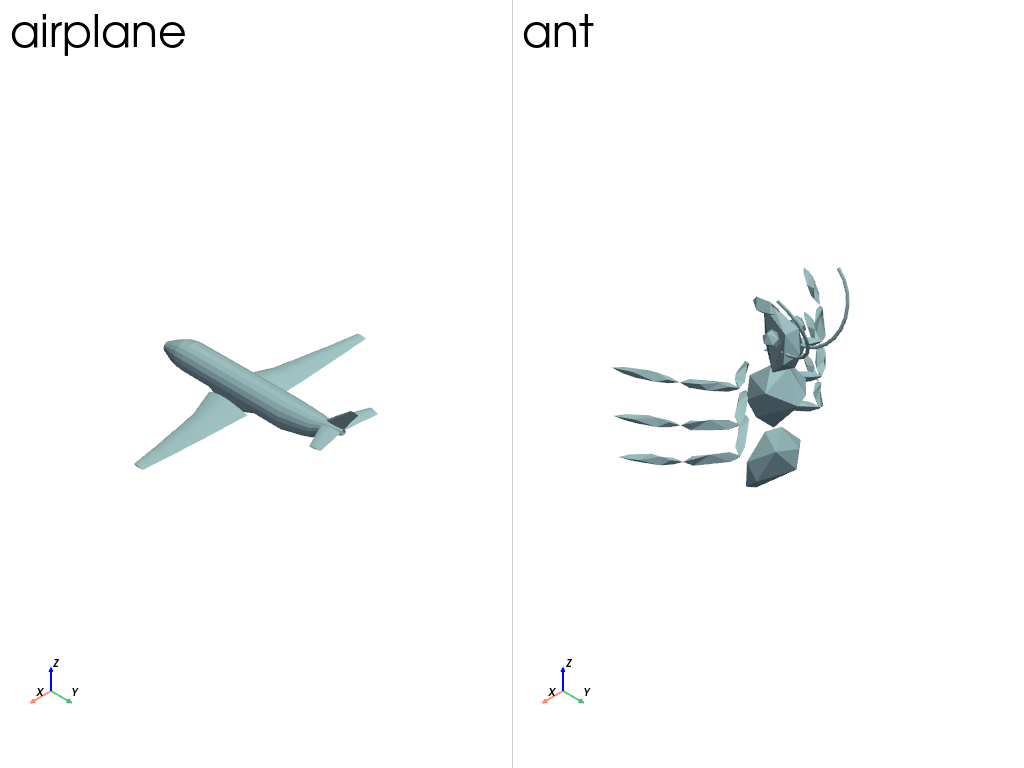
Datasets of very different sizes are compared shape by shape by normalizing them. The airplane is some forty times the size of the ant, which is a speck beside it otherwise.
>>> pv.plot_compare(
...     {
...         'airplane': examples.load_airplane(),
...         'ant': examples.load_ant(),
...     },
...     normalize=True,
... )
Add a border around the whole comparison, on top of the lines already separating the subplots by default.
>>> pv.plot_compare(blocks, border=True, border_color='grey')
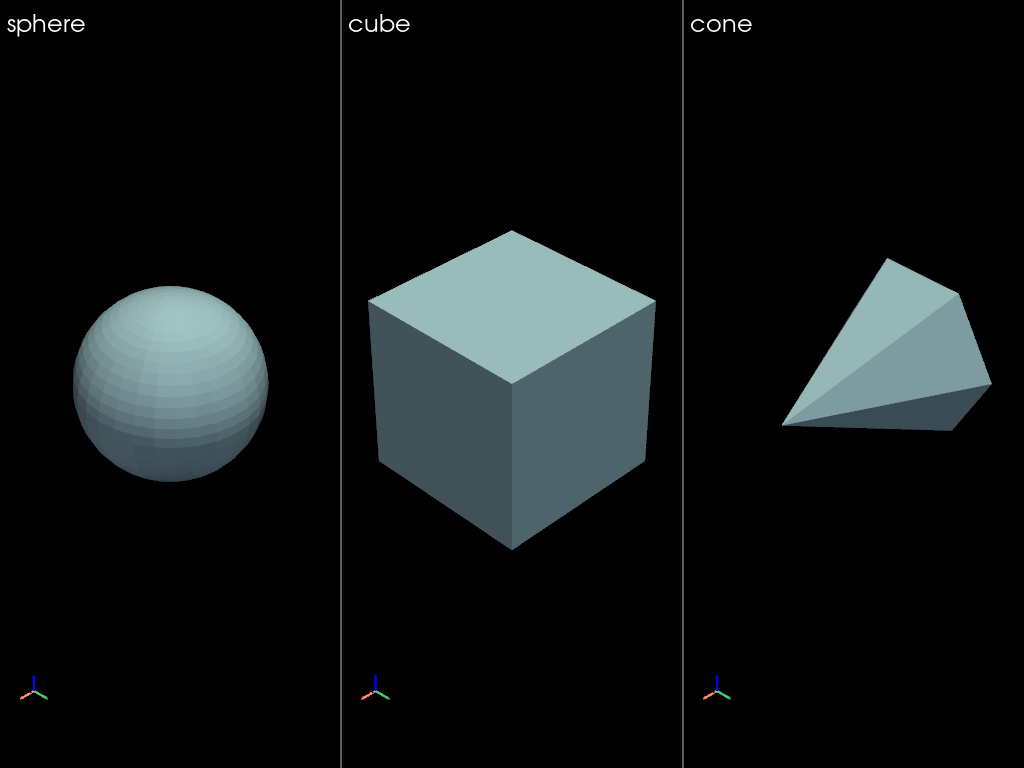
Plot on a dark background by giving the plotter a theme of its own, which also decides the color the labels are drawn in.
>>> pv.plot_compare(blocks, theme='dark')
See Also#
Used In#
API Examples
DataObjectFilters.resample_to_image(1 use)PolyDataFilters.smooth_taubin(1 use)
Gallery Examples