
Reslice Images#
Download Python source code | Download Jupyter notebook
Sample an image at the points of another image.
reslice() builds a new image by
interpolating an existing one at the points of a reference image, so the two
end up on a common grid. It can apply a transform as it samples, including one
no image geometry could hold.
Along the way it is compared with the filters which answer nearby questions:
resample(),
sample(),
crop() and
transform().
See Slicing Oblique Anatomy for the filter used on a medical scan.
import numpy as np

import pyvista as pv
from pyvista import examples
Put Two Images on One Grid#
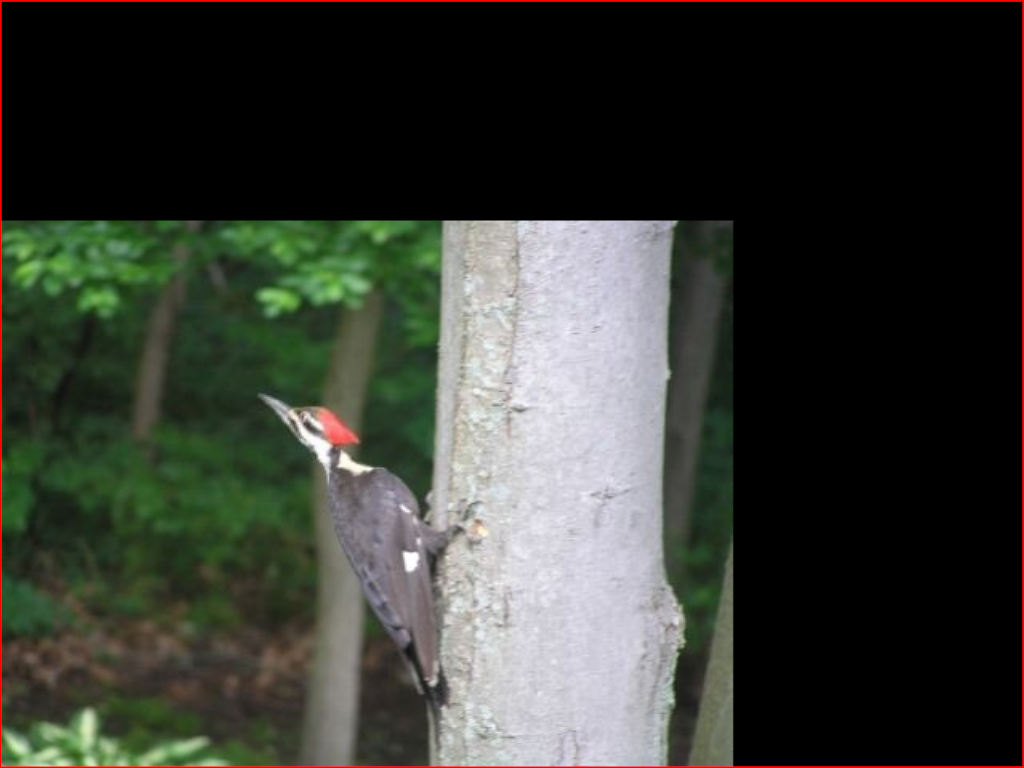
Load two photographs. The bird is smaller than the gourds, and both start at the origin with unit spacing, so the bird covers the lower left corner of the region the gourds cover.
(458, 342, 1) (640, 480, 1)
reslice samples the bird at the points of the gourds image. The bird keeps
its size and position, and the reference points which fall outside it take
background_value.
resliced = bird.reslice(gourds, 'linear', background_value=0)
Plot the result with the outline of the gourds image in red. The bird fills the corner of the grid it occupies and the rest is background.
pl = pv.Plotter()
pl.add_mesh(resliced, rgba=True, lighting=False)
pl.add_mesh(gourds.outline(), color='red', line_width=3)
pl.view_xy()
pl.camera.tight()
pl.show()
Compare Filters With a Reference Image#
Several filters can put an image onto the geometry of another one, and they do
not all mean the same thing by it. Only reslice reads the image where the
reference actually lies.
The differences are clearest on an image coarse enough to see every sample. Generate a small Mandelbrot set, and a reference which covers part of it at a finer spacing.
mandelbrot = pv.ImageMandelbrotSource(
    whole_extent=(0, 23, 0, 17, 0, 0), maxiter=25
).output
reference = pv.ImageData(
    dimensions=(17, 17, 1), spacing=(0.05, 0.05, 1.0), origin=(-1.0, -0.4, 0.0)
)
reslice returns that region of the image, sampled at the reference’s
points. resample() takes the reference as a
description of the output geometry alone, so it returns the whole image
squeezed into it.
resliced = mandelbrot.reslice(reference, 'linear')
resampled = mandelbrot.resample(reference_image=reference, interpolation='linear')
sample() asks the same question reslice
does, but for meshes in general, by probing one dataset at the points of
another.
The fourth way is by hand: cut the region out of the image and resample the
cut to the reference’s spacing. crop() works
in index space, so the reference’s bounds have to be converted into the
image’s indices first.
lo = np.floor((np.array(reference.bounds[::2]) - mandelbrot.origin) / mandelbrot.spacing)
hi = np.ceil((np.array(reference.bounds[1::2]) - mandelbrot.origin) / mandelbrot.spacing)
cropped = mandelbrot.crop(extent=np.column_stack([lo, hi]).astype(int).ravel())
sample_rate = np.array(cropped.spacing) / reference.spacing
cropped_resampled = cropped.resample(
    (*sample_rate[:2], 1.0), 'linear', extend_border=False
)
Plot each output over the image it came from. Use
points_to_cells() to draw the samples as
PIXEL cells with their edges showing, and outline
the reference region in red. The resliced samples continue the picture around
them, because that is where they were taken, and the sampled ones agree with
them. The resampled ones are the whole set shrunk into the frame. The cropped
ones carry the right picture but not the right grid.
clim = mandelbrot.get_data_range()
voxels = mandelbrot.points_to_cells()


outputs = {
    'reslice': resliced,
    'sample': sampled,
    'resample': resampled,
    'crop+resample': cropped_resampled,
}
panels = {
    label: pv.MultiBlock([voxels, output.points_to_cells()])
    for label, output in outputs.items()
}
pv.plot_compare(
    panels,
    reference_mesh=reference.points_to_cells().outline(),
    reference_kwargs={'color': 'red', 'line_width': 4},
    label_kwargs={'color': 'white'},
    shape=(2, 2),
    border_color='white',
    border_width=3,
    clim=clim,
    show_edges=True,
    lighting=False,
    show_scalar_bar=False,
    show_axes=False,
    cpos='xy',
    zoom='tight',
)
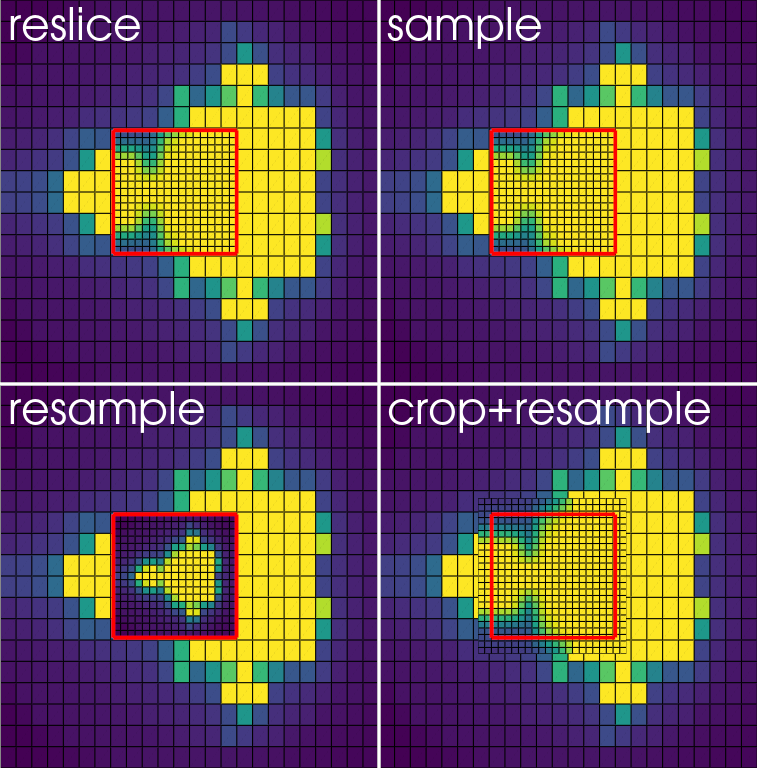
reslice and sample agree to floating point precision, since both read
the image at the reference’s points. sample works on any dataset and
returns the mask arrays that go with probing, while reslice is the image
filter and carries the border, interpolation, and anti-aliasing options an
image needs.
resample also carries the reference’s geometry, since that is what
reference_image asks for, but it stretched the whole image onto it rather
than reading at its points. The crop can only land on whole input voxels, so
it covers more than the reference asked for and its spacing cannot match
either.
print(resliced.origin, resliced.spacing)
print(resampled.origin, resampled.spacing)
print(cropped_resampled.origin, cropped_resampled.spacing)
(-1.0, -0.4, 0.0) (0.05, 0.05, 1.0)
(-1.0, -0.4, 0.0) (0.05, 0.05, 1.0)
(-1.3773291925465838, -0.7384910485933504, 0.0) (0.046583850931677016, 0.04475703324808185, 0.01)
The crop can be made to reproduce reslice exactly, but only when the
reference is placed on whole input voxels and sized to them by hand, and
extend_border is disabled so the output keeps the crop’s point bounds
rather than its cell bounds.
extent = (7, 14, 5, 12, 0, 0)
dimensions = (17, 17, 1)
step = np.array(mandelbrot.spacing[:2])
lo = np.array(mandelbrot.origin[:2]) + step * extent[:4:2]
hi = np.array(mandelbrot.origin[:2]) + step * extent[1:4:2]
aligned = pv.ImageData(
    dimensions=dimensions,
    spacing=(*(hi - lo) / (np.array(dimensions[:2]) - 1), 1.0),
    origin=(*lo, 0.0),
)

by_reslice = mandelbrot.reslice(aligned, 'linear')
by_crop = mandelbrot.crop(extent=extent).resample(
    dimensions=dimensions, interpolation='linear', extend_border=False
)
The two agree exactly. reslice does nothing the other filters cannot; it
does it from the reference alone, which is the whole of its value.
True
True
Compare With the Transform Filter#
Rotating an image with transform() and
reslicing it through the same rotation are different operations. transform
moves the image and leaves the values alone, recording the rotation in the
image’s direction_matrix. reslice interpolates
the values onto the reference’s points, so the output keeps the reference’s
geometry.
Rotate the gourds about their own center, so the picture turns in place.
center = gourds.center
rotate = pv.Transform().translate(-np.array(center)).rotate_z(30).translate(center)

moved = gourds.transform(rotate, inplace=False)
resliced = gourds.reslice(gourds, 'linear', transform=rotate, background_value=0)
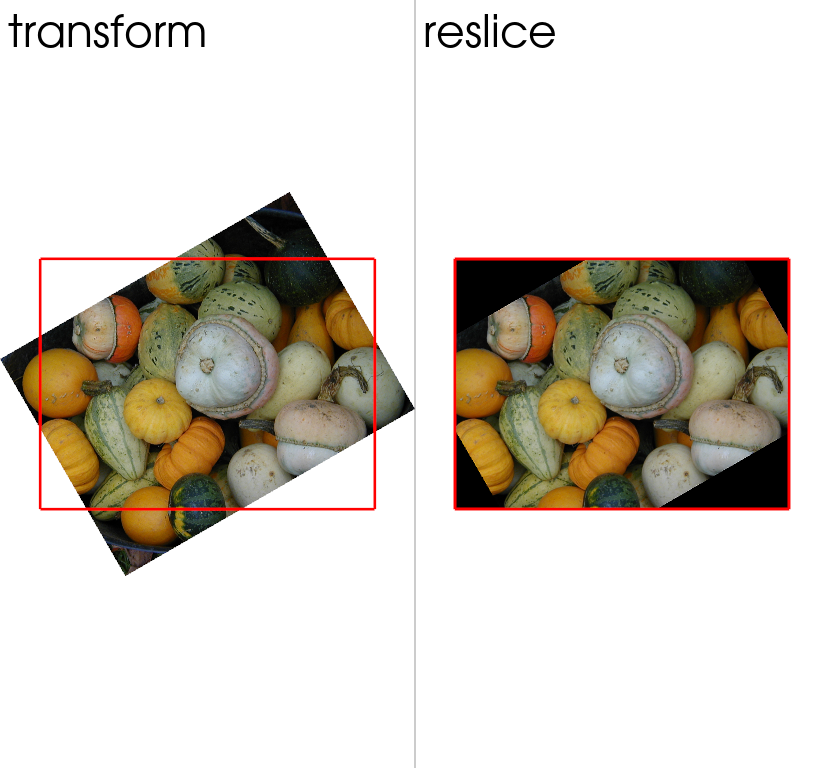
The moved image carries the rotation in the matrix which maps its indices to physical space. The resliced one is still on the axes it started on, and only its values changed.
print(moved.index_to_physical_matrix.round(3))
print(resliced.index_to_physical_matrix.round(3))
[[   0.866   -0.5      0.     162.555]
 [   0.5      0.866    0.    -127.663]
 [   0.       0.       1.       0.   ]
 [   0.       0.       0.       1.   ]]
[[1. 0. 0. 0.]
 [0. 1. 0. 0.]
 [0. 0. 1. 0.]
 [0. 0. 0. 1.]]
Plot both with the outline of the original image in red. transform leaves
the picture where the rotation put it, overhanging the frame at the corners,
while reslice returns the frame itself and writes background_value
into the corners the rotated image no longer reaches.
pv.plot_compare(
    {'transform': moved, 'reslice': resliced},
    reference_mesh=gourds.outline(),
    reference_kwargs={'color': 'red', 'line_width': 3},
    rgba=True,
    lighting=False,
    show_axes=False,
    cpos='xy',
    zoom='tight',
)
The two are not alternatives so much as two halves of the same operation.
Moving the image with transform and then reslicing the result gives the
same values as passing the rotation to reslice directly, so transform=
is a shortcut for moving the image and then sampling it onto the reference,
done in one pass without building the moved image.
through = moved.reslice(gourds, 'linear', background_value=0)
print(np.array_equal(through.active_scalars, resliced.active_scalars))
True
Use transform= when the output should land on the reference’s grid. Use
the transform filter on its own to move an image without touching its
values at all.
Use a Non-Linear Transformation#
transform is limited to what an image’s geometry can hold: an origin, a
spacing and an orthogonal direction_matrix.
reslice resamples the values instead, so it also accepts transformations
no image geometry could express. A thin plate spline bends space so that one
set of points lands on another, which is the kind of deformation a non-rigid
registration produces.
PyVista has no class for one, so use VTK’s directly.
from vtkmodules.vtkCommonTransforms import vtkThinPlateSplineTransform
Pin the four corners of the photograph and pull its middle to one side.
width, height = np.array(gourds.dimensions[:2]) - 1
corners = [(0, 0, 0), (width, 0, 0), (0, height, 0), (width, height, 0)]

warp = vtkThinPlateSplineTransform()
warp.SetSourceLandmarks(pv.vtk_points([*corners, (width / 2, height / 2, 0)]))
warp.SetTargetLandmarks(pv.vtk_points([*corners, (width / 2 + 90, height / 2, 0)]))
warp.SetBasisToR2LogR()

warped = gourds.reslice(gourds, 'linear', transform=warp, background_value=0)
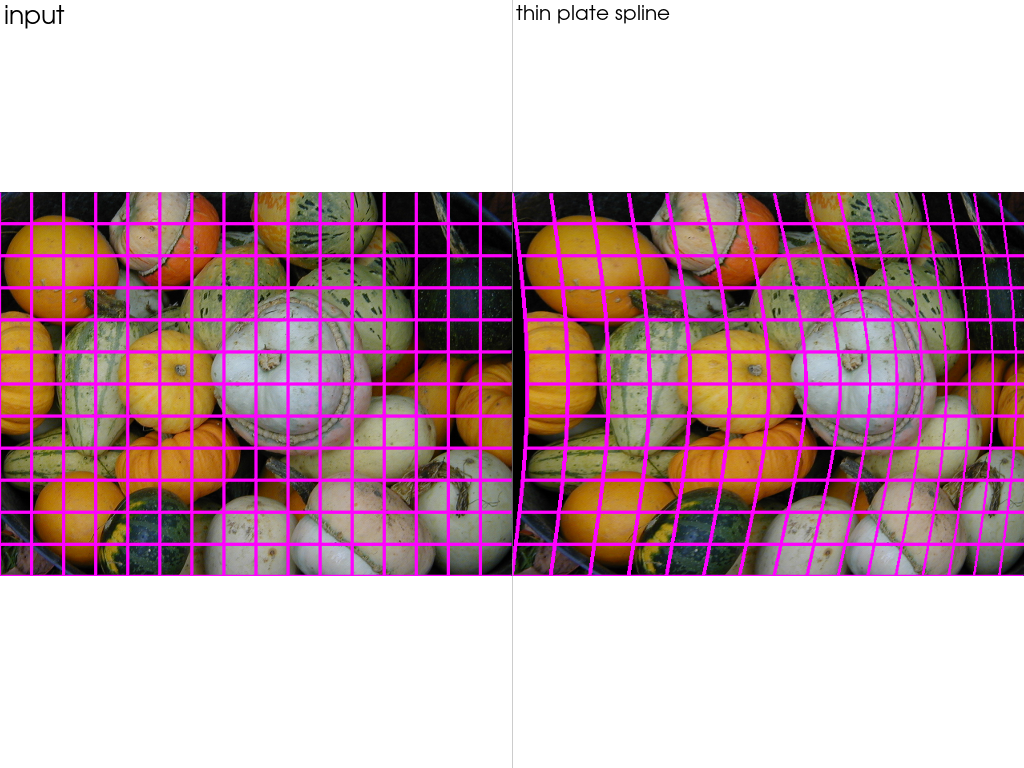
The deformation is easier to read on a regular grid than on the photograph, so build one covering the same region and put it through the same reslice.
grid = pv.ImageGridSource(
    extent=(0, width // 4, 0, height // 4, 0, 0), spacing=(4, 4, 1)
).output

lines = grid.reslice(gourds, 'nearest')
warped_lines = grid.reslice(gourds, 'nearest', transform=warp)
Draw each grid over the image it belongs to, using its values as opacity so
only the lines show. The picture is stretched on one side of the middle and
squeezed on the other, while the pinned corners stay where they are.
transform could not have done this: it would have to keep the image’s
samples on a regular grid.
panels = [(gourds, lines, 'input'), (warped, warped_lines, 'thin plate spline')]
pl = pv.Plotter(shape=(1, 2))
for index, (image, overlay, label) in enumerate(panels):
    pl.subplot(0, index)
    pl.add_mesh(image, rgba=True, lighting=False)
    pl.add_mesh(
        overlay.translate((0, 0, 1)),
        color='magenta',
        opacity='ImageScalars',
        show_scalar_bar=False,
        lighting=False,
    )
    pl.add_text(label, font_size=10)
    pl.view_xy()
    pl.camera.tight()
pl.show()
Total running time of the script: (0 minutes 6.324 seconds)
