
BarPlot#
- class BarPlot(*args, **kwargs)[source]#
Class representing a 2D bar plot.
Users should typically not directly create new plot instances, but use the dedicated 2D chart’s plotting methods.
- Parameters:
- chart
Chart2D The chart containing this plot.
- xarray_like
Positions (along the x-axis for a vertical orientation, along the y-axis for a horizontal orientation) of the bars to draw.
- yarray_like
Size of the bars to draw. Multiple bars can be stacked by passing a sequence of sequences.
- color
ColorLike, default: “b” Color of the bars drawn in this plot. Any color parsable by
pyvista.Coloris allowed.- orientation
str, default: “V” Orientation of the bars drawn in this plot. Either
"H"for an horizontal orientation or"V"for a vertical orientation.- label
str, default: “” Label of this plot, as shown in the chart’s legend.
- chart
Examples#
Download Python source code | Download Jupyter notebook
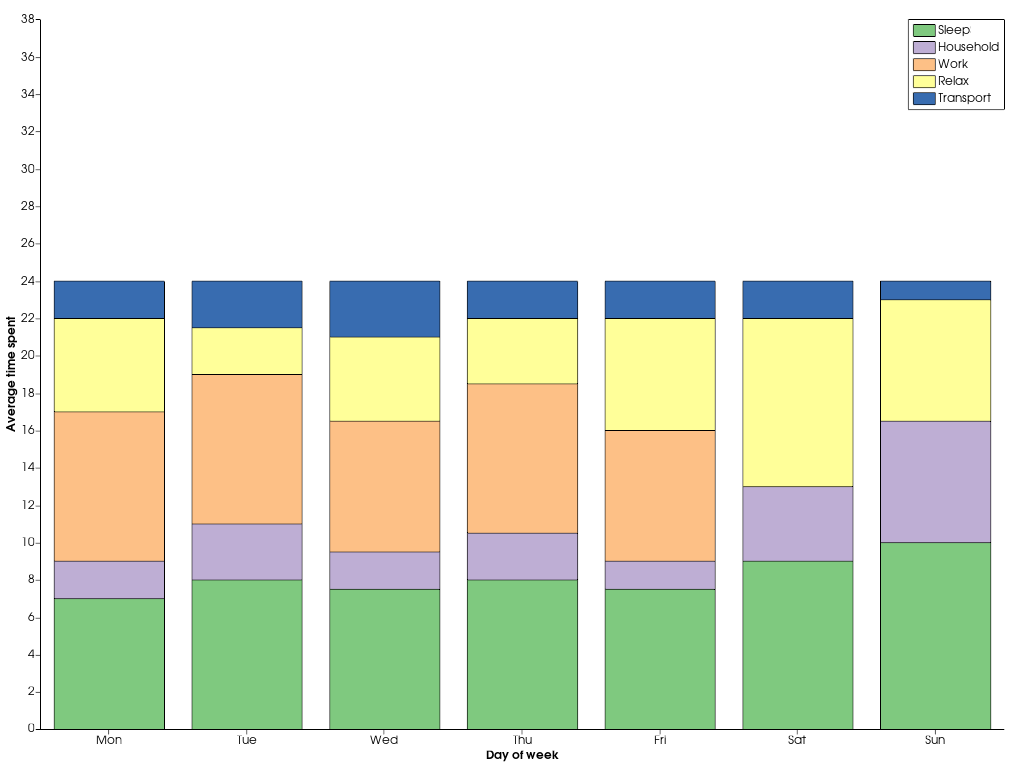
Create a stacked bar chart showing the average time spent on activities throughout the week.
>>> import pyvista as pv
>>> import numpy as np
>>> x = np.arange(1, 8)
>>> y_s = [7, 8, 7.5, 8, 7.5, 9, 10]
>>> y_h = [2, 3, 2, 2.5, 1.5, 4, 6.5]
>>> y_w = [8, 8, 7, 8, 7, 0, 0]
>>> y_r = [5, 2.5, 4.5, 3.5, 6, 9, 6.5]
>>> y_t = [2, 2.5, 3, 2, 2, 2, 1]
>>> labels = ['Sleep', 'Household', 'Work', 'Relax', 'Transport']
>>> chart = pv.Chart2D()
>>> _ = chart.bar(x, [y_s, y_h, y_w, y_r, y_t], label=labels)
>>> chart.x_axis.tick_locations = x
>>> chart.x_axis.tick_labels = [
...     'Mon',
...     'Tue',
...     'Wed',
...     'Thu',
...     'Fri',
...     'Sat',
...     'Sun',
... ]
>>> chart.x_label = 'Day of week'
>>> chart.y_label = 'Average time spent'
>>> chart.grid = False  # Disable the grid lines
>>> chart.show()
Inheritance#
Wraps vtkPlotBar.
Attributes#
Brush object controlling how shapes in this plot are filled. |
|
Return or set the plot's color. |
|
Return or set the plot's color scheme. |
|
Return or set the plot's colors. |
|
Return or set the this plot's label, as shown in the chart's legend. |
|
Return or set the this plot's labels, as shown in the chart's legend. |
|
Return or set the line style of all lines drawn in this plot. |
|
Return or set the line width of all lines drawn in this plot. |
|
Return or set the orientation of the bars in this plot. |
|
Pen object controlling how lines in this plot are drawn. |
|
Return or set the this plot's visibility. |
|
Retrieve the positions of the drawn bars. |
|
Retrieve the sizes of the drawn bars. |
Methods#
Toggle the plot's visibility. |
|
|
Update the positions and/or size of the bars in this plot. |
