pyvista.Plotter.add_bounding_box#
- Plotter.add_bounding_box(
- color='grey',
- corner_factor=0.5,
- line_width=None,
- opacity=1.0,
- render_lines_as_tubes=False,
- lighting=None,
- reset_camera=None,
- outline=True,
- culling='front',
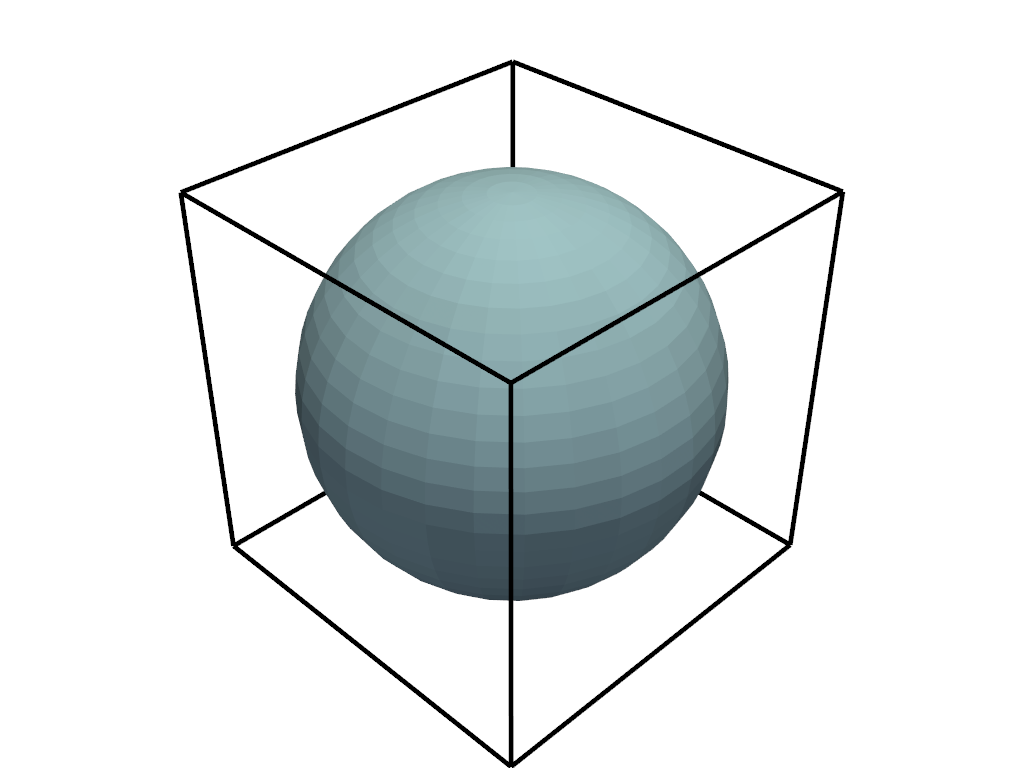
Add an unlabeled and unticked box at the boundaries of plot.
Useful for when wanting to plot outer grids while still retaining all edges of the boundary.
- Parameters:
- color
ColorLike, default: “grey” Color of all labels and axis titles. Default white. Either a string, rgb sequence, or hex color string. For example:
color='white'color='w'color=[1.0, 1.0, 1.0]color='#FFFFFF'
- corner_factor
float, default: 0.5 This is the factor along each axis to draw the default box. Default is 0.5 to show the full box.
- line_width
float,optional Thickness of lines.
- opacity
float, default: 1.0 Opacity of mesh. Should be between 0 and 1.
- render_lines_as_tubesbool, default:
False Show lines as thick tubes rather than flat lines. Control the width with
line_width.- lightingbool,
optional Enable or disable directional lighting for this actor.
- reset_camerabool,
optional Reset camera position when
Trueto include all actors.- outlinebool, default:
True Default is
True. whenFalse, a box with faces is shown with the specified culling.- culling
str, default: “front” Does not render faces on the bounding box that are culled. Options are
'front'or'back'.
- color
- Returns:
- vtkActor
VTK actor of the bounding box.
See also
pyvista.DataSetFilters.bounding_boxCreate a bounding box or oriented bounding box for a dataset.
Examples
>>> import pyvista as pv
>>> pl = pv.Plotter()
>>> _ = pl.add_mesh(pv.Sphere())
>>> _ = pl.add_bounding_box(line_width=5, color='black')
>>> pl.show()
