
StackPlot#
- class StackPlot(*args, **kwargs)[source]#
Class representing a 2D stack plot.
Users should typically not directly create new plot instances, but use the dedicated 2D chart’s plotting methods.
- Parameters:
- chart
Chart2D The chart containing this plot.
- xarray_like
X coordinates of the points outlining the stacks (areas) to draw.
- yssequence[array_like]
Size of the stacks (areas) to draw at the corresponding X coordinates. Each sequence defines the sizes of one stack (area), which are stacked on top of each other.
- colorssequence[
ColorLike], optional Color of the stacks (areas) drawn in this plot. Any color parsable by
pyvista.Coloris allowed.- labelssequence[
str], default: [] Label for each stack (area) drawn in this plot, as shown in the chart’s legend.
- chart
Examples#
Download Python source code | Download Jupyter notebook
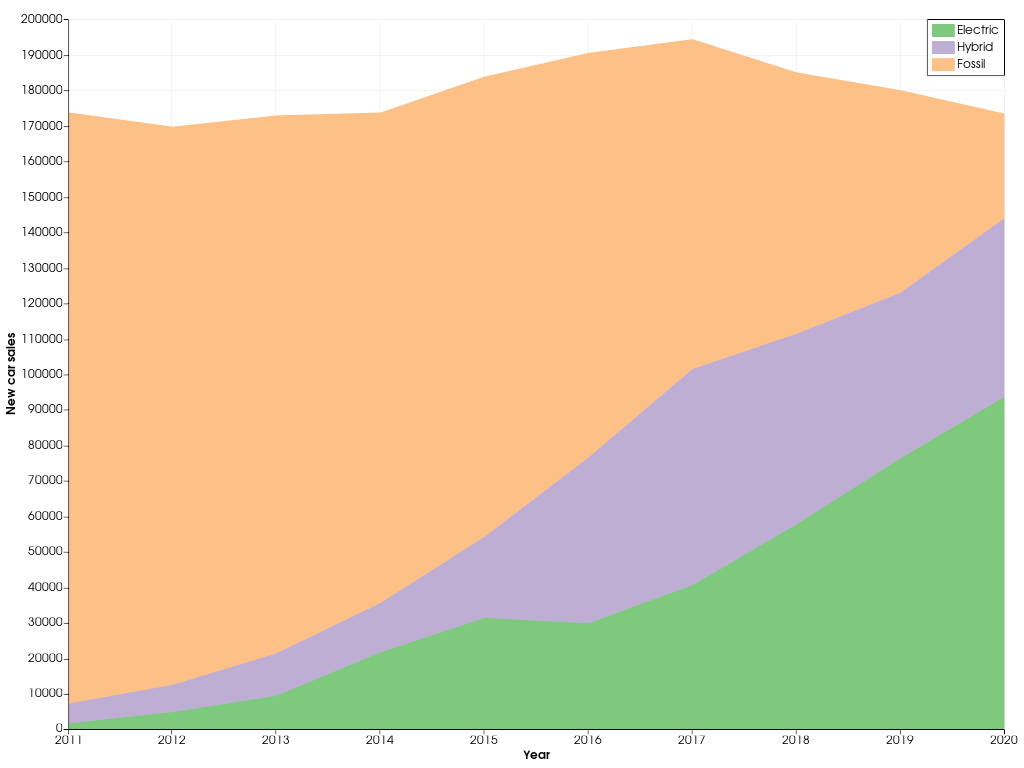
Create a stack plot showing the amount of vehicles sold per type.
>>> import pyvista as pv
>>> import numpy as np
>>> year = [f'{y}' for y in np.arange(2011, 2021)]
>>> x = np.arange(len(year))
>>> n_e = [1739, 4925, 9515, 21727, 31452, 29926, 40648, 57761, 76370, 93702]
>>> n_h = [5563, 7642, 11937, 13905, 22807, 46700, 60875, 53689, 46650, 50321]
>>> n_f = [
...     166556,
...     157249,
...     151552,
...     138183,
...     129669,
...     113985,
...     92965,
...     73683,
...     57097,
...     29499,
... ]
>>> chart = pv.Chart2D()
>>> plot = chart.stack(x, [n_e, n_h, n_f])
>>> plot.labels = ['Electric', 'Hybrid', 'Fossil']
>>> chart.x_axis.label = 'Year'
>>> chart.x_axis.tick_locations = x
>>> chart.x_axis.tick_labels = year
>>> chart.y_axis.label = 'New car sales'
>>> chart.show()
Inheritance#
Wraps vtkPlotStacked.
Attributes#
Brush object controlling how shapes in this plot are filled. |
|
Return or set the plot's color. |
|
Return or set the plot's color scheme. |
|
Return or set the plot's colors. |
|
Return or set the this plot's label, as shown in the chart's legend. |
|
Return or set the this plot's labels, as shown in the chart's legend. |
|
Return or set the line style of all lines drawn in this plot. |
|
Return or set the line width of all lines drawn in this plot. |
|
Pen object controlling how lines in this plot are drawn. |
|
Return or set the this plot's visibility. |
|
Retrieve the X coordinates of the drawn stacks. |
|
Retrieve the sizes of the drawn stacks. |
Methods#
Toggle the plot's visibility. |
|
|
Update the locations and/or size of the stacks (areas) in this plot. |
