pyvista.plotting.charts.StackPlot.update#
- StackPlot.update(x, ys)[source]#
Update the locations and/or size of the stacks (areas) in this plot.
- Parameters:
- xarray_like
The new x coordinates of the stacks (areas) to draw.
- yssequence[array_like]
The new sizes of the stacks (areas) to draw.
Examples
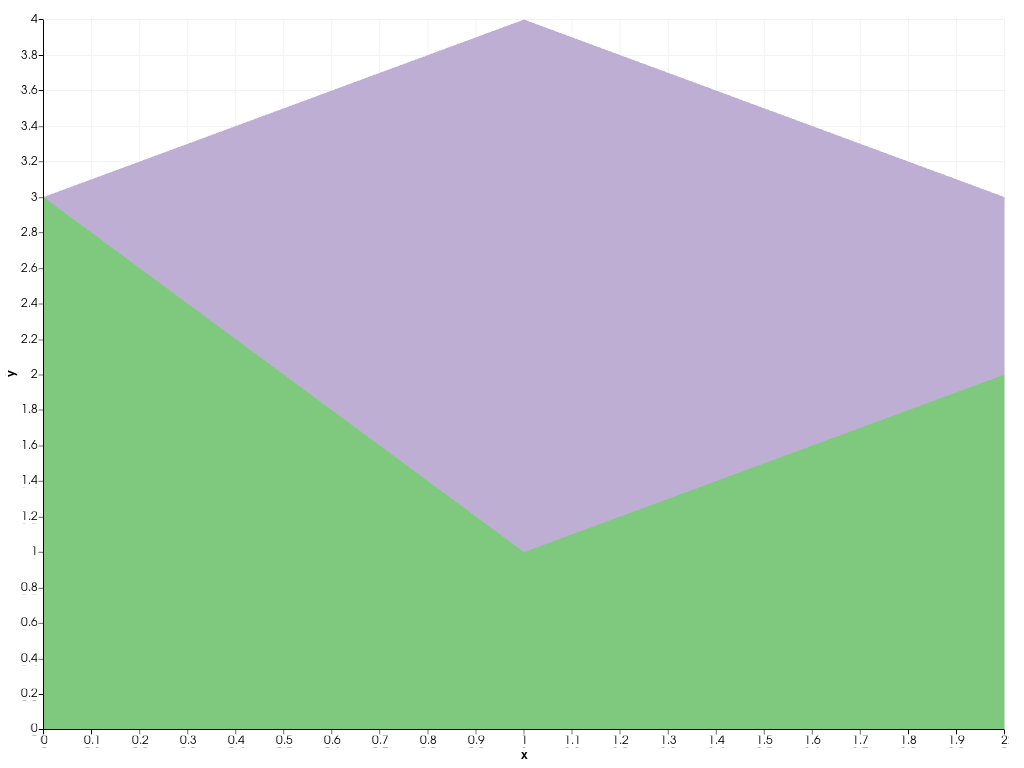
Create a stack plot.
>>> import pyvista as pv
>>> chart = pv.Chart2D()
>>> plot = chart.stack([0, 1, 2], [[2, 1, 3],[1, 2, 1]])
>>> chart.show()
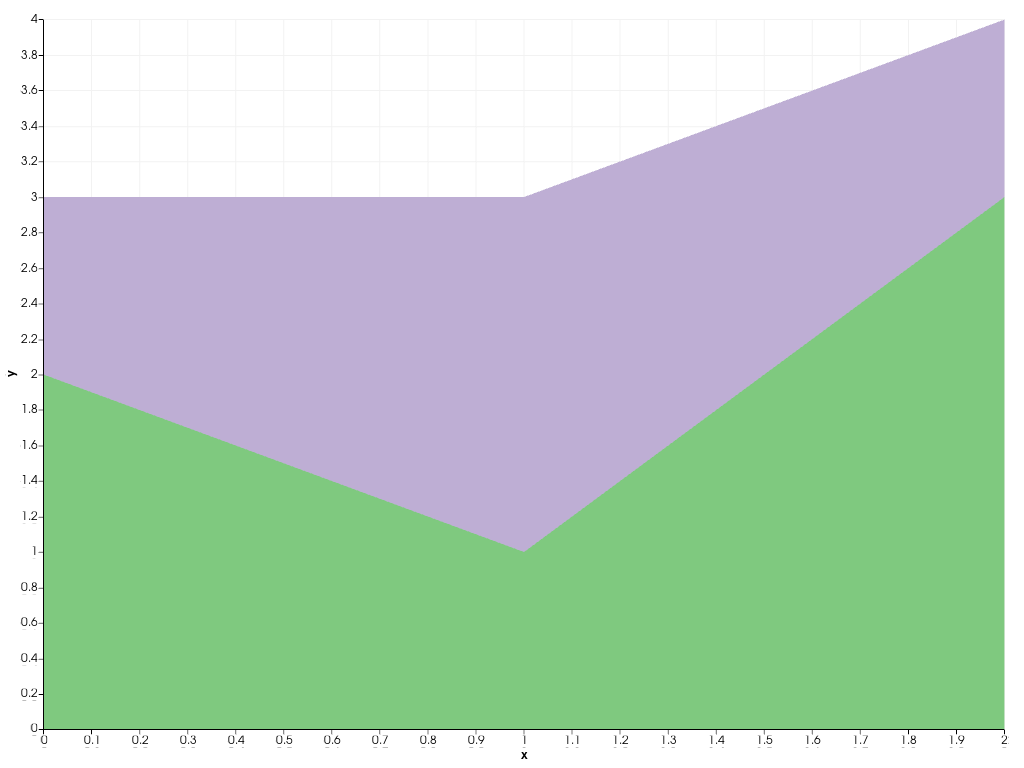
Update the stack sizes.
>>> plot.update([0, 1, 2], [[3, 1, 2], [0, 3, 1]])
>>> chart.show()