Plotter.add_mesh_isovalue#
- Plotter.add_mesh_isovalue(
- mesh,
- scalars=None,
- compute_normals: bool = False,
- compute_gradients: bool = False,
- compute_scalars: bool = True,
- preference='point',
- title=None,
- pointa=(0.4, 0.9),
- pointb=(0.9, 0.9),
- widget_color=None,
- **kwargs,
Create a contour of a mesh with a slider.
Add a mesh to the scene with a slider widget that is used to contour at an isovalue of the point data on the mesh interactively.
The isovalue mesh is saved to the
.isovalue_meshesattribute on the plotter.Warning
This will not work with
pyvista.PointSetas creating an isovalue is a dimension reducing operation on the geometry and point clouds are zero dimensional. This will similarly fail for point clouds inpyvista.PolyData.- Parameters:
- mesh
DataSetor vtkAlgorithm The input dataset to add to the scene and contour or algorithm that produces said mesh.
- scalars
str,optional The string name of the scalars on the mesh to contour and display.
- compute_normalsbool,
optional Enable or disable the computation of normals. If the output data will be processed by filters that modify topology or geometry, it may be wise to disable computing normals.
- compute_gradientsbool,
optional Enable or disable the computation of gradients. If the output data will be processed by filters that modify topology or geometry, it may be wise to disable computing gradients.
- compute_scalarsbool,
optional Enable or disable the computation of scalars.
- preference
str,optional When
mesh.n_points == mesh.n_cellsand setting scalars, this parameter sets how the scalars will be mapped to the mesh. Default'point', causes the scalars will be associated with the mesh points. Can be either'point'or'cell'.- title
str,optional The string label of the slider widget.
- pointasequence,
optional The relative coordinates of the left point of the slider on the display port.
- pointbsequence
The relative coordinates of the right point of the slider on the display port.
- widget_color
ColorLike,optional Color of the widget. Either a string, RGB sequence, or hex color string. For example:
color='white'color='w'color=[1.0, 1.0, 1.0]color='#FFFFFF'
- **kwargs
dict,optional All additional keyword arguments are passed to
pyvista.Plotter.add_mesh()to control how the mesh is displayed.
- mesh
- Returns:
- vtkActor
VTK actor of the mesh.
Examples
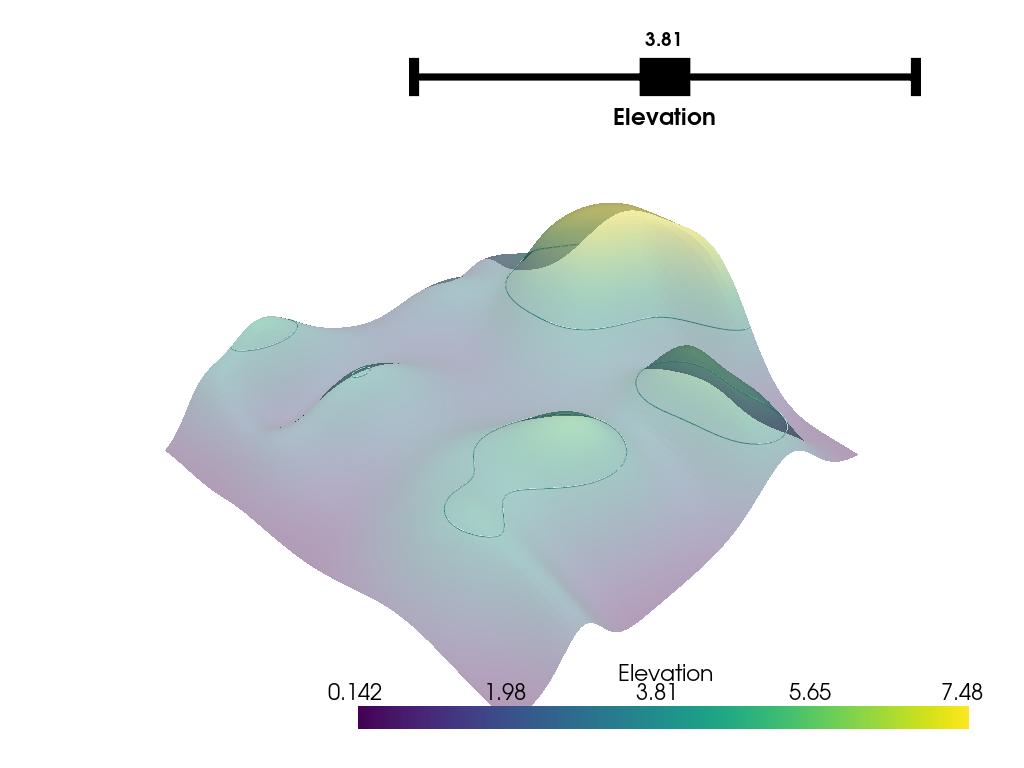
Shows an interactive slider controlling the altitude of the contours.
>>> import pyvista as pv
>>> from pyvista import examples
>>> pl = pv.Plotter()
>>> mesh = examples.load_random_hills()
>>> _ = pl.add_mesh(mesh, opacity=0.4)
>>> _ = pl.add_mesh_isovalue(mesh)
>>> pl.show()