LookupTable.apply_opacity#
- LookupTable.apply_opacity(opacity, interpolate: bool = True, kind: str = 'quadratic')[source]#
Assign custom opacity to this lookup table.
- Parameters:
- opacity
float| array_like[float] |str The opacity mapping to use. Can be a
strname of a predefined mapping including'linear','geom','sigmoid','sigmoid_3-10'. Append an'_r'to any of those names to reverse that mapping. This can also be a custom array or list of values that will be interpolated across then_colorrange for user defined mappings. Values must be between 0 and 1.If a
float, simply applies the same opacity across the entire colormap and must be between 0 and 1. Note thatintvalues are interpreted as if they were floats.- interpolatebool, default:
True Flag on whether or not to interpolate the opacity mapping for all colors.
- kind
str, default: ‘quadratic’ The interpolation kind if
interpolateisTrueandscipyis available. Seescipy.interpolate.interp1dfor the available interpolation kinds.If
scipyis not available,'linear'interpolation is used.
- opacity
Examples
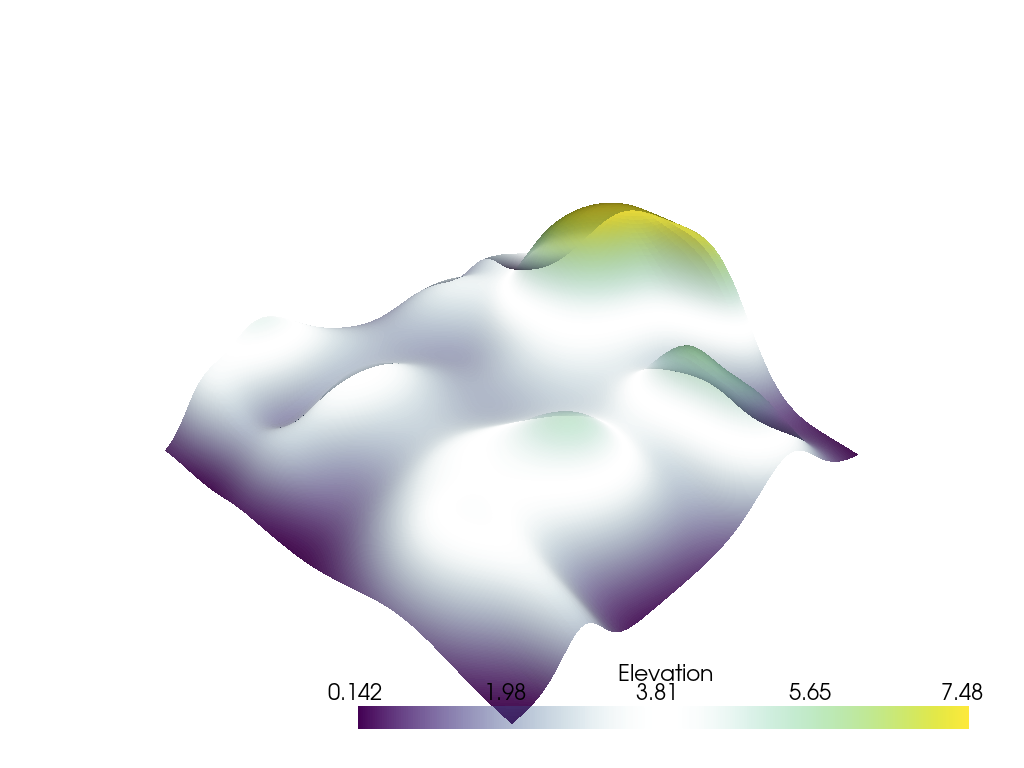
Apply a user defined custom opacity to a lookup table and plot the random hills example.
>>> import pyvista as pv
>>> from pyvista import examples
>>> mesh = examples.load_random_hills()
>>> lut = pv.LookupTable(cmap='viridis')
>>> lut.apply_opacity([1.0, 0.4, 0.0, 0.4, 0.9])
>>> lut.scalar_range = (
...     mesh.active_scalars.min(),
...     mesh.active_scalars.max(),
... )
>>> pl = pv.Plotter()
>>> _ = pl.add_mesh(mesh, cmap=lut)
>>> pl.show()