BezierCurve#
- BezierCurve(*, cell_order: int = 3) UnstructuredGrid[source]#
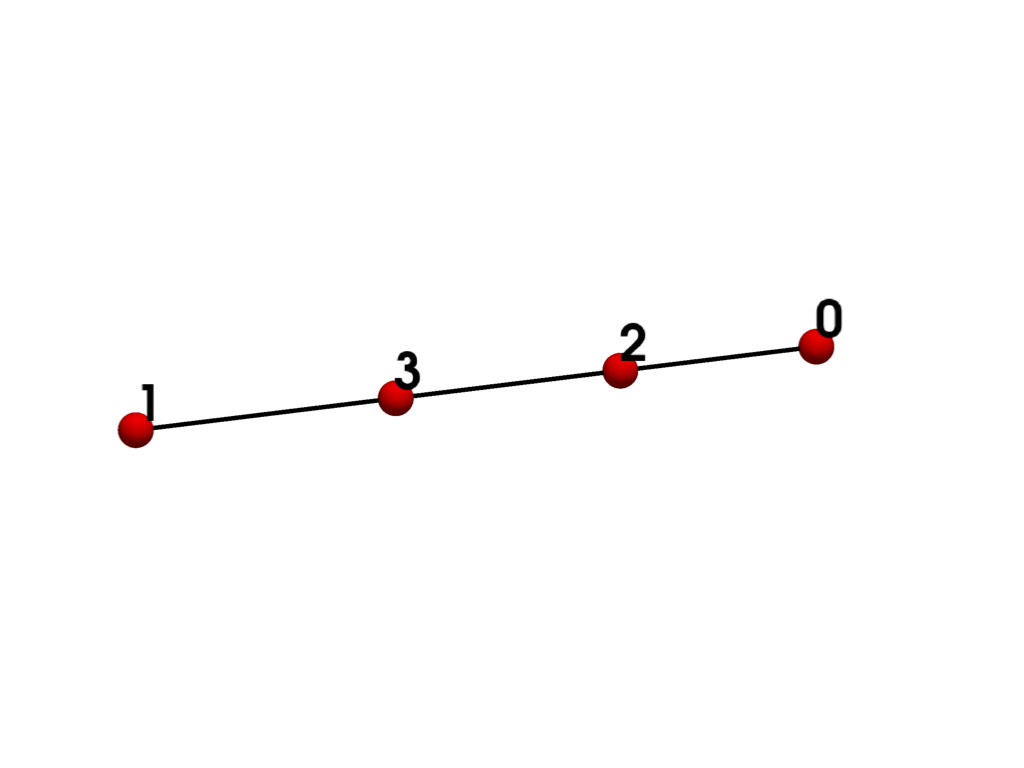
Create a
pyvista.UnstructuredGridcontaining a single Bezier curve.This cell corresponds to the
pyvista.CellType.BEZIER_CURVEcell type.- Parameters:
- cell_order
int, default: 3 Order of interpolation to use.
- cell_order
- Returns:
pyvista.UnstructuredGridUnstructuredGrid containing a single Bezier curve.
Examples
Create and plot a single Bezier curve.
>>> from pyvista import examples
>>> grid = examples.cells.BezierCurve()
>>> examples.plot_cell(grid)
List the grid’s cells.
>>> grid.cells
array([4, 0, 1, 2, 3])
List the grid’s points.
>>> grid.points
pyvista_ndarray([[0.        , 0.        , 0.        ],
                 [1.        , 0.        , 0.        ],
                 [0.33333334, 0.        , 0.        ],
                 [0.66666669, 0.        , 0.        ]])
>>> grid.celltypes  # same as pyvista.CellType.BEZIER_CURVE
array([75], dtype=uint8)
