Note
Go to the end to download the full example code.
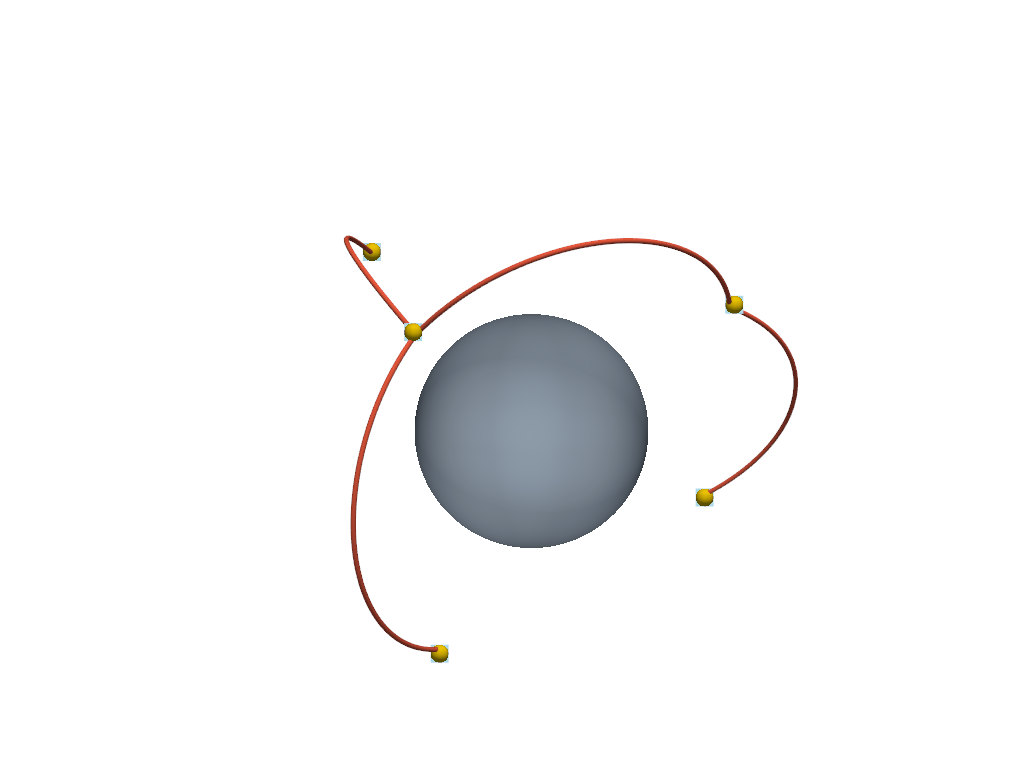
Plot Curved Flight Paths on a Globe#
Connect cities with elevated circular arcs from pyvista.CircularArc() to
create a simple route map.
import numpy as np
import pyvista as pv


def latlon_to_xyz(latitude: float, longitude: float, radius: float = 1.0) -> np.ndarray:
    """Convert latitude and longitude in degrees to Cartesian coordinates."""
    lat = np.deg2rad(latitude)
    lon = np.deg2rad(longitude)
    return np.array(
        [
            radius * np.cos(lat) * np.cos(lon),
            radius * np.cos(lat) * np.sin(lon),
            radius * np.sin(lat),
        ],
    )
Define city locations and routes#
The routes are lifted slightly above the globe to keep them visible.
cities = {
    'New York': latlon_to_xyz(40.7128, -74.0060, radius=1.02),
    'London': latlon_to_xyz(51.5074, -0.1278, radius=1.02),
    'Tokyo': latlon_to_xyz(35.6762, 139.6503, radius=1.02),
    'Sydney': latlon_to_xyz(-33.8688, 151.2093, radius=1.02),
    'Cape Town': latlon_to_xyz(-33.9249, 18.4241, radius=1.02),
}
routes = [
    ('New York', 'London'),
    ('London', 'Tokyo'),
    ('Tokyo', 'Sydney'),
    ('Cape Town', 'London'),
]

arcs = []
for start, stop in routes:
    arc = pv.CircularArc(
        pointa=cities[start], pointb=cities[stop], center=(0, 0, 0), resolution=150
    )
    scale = 1.0 + 0.18 * np.sin(np.linspace(0, np.pi, arc.n_points))
    directions = arc.points / np.linalg.norm(arc.points, axis=1)[:, None]
    arc.points = directions * scale[:, None]
    arcs.append(arc.tube(radius=0.01))
Render the route map#
Great-circle arcs follow the curvature of the sphere instead of cutting straight through it.
earth = pv.Sphere(theta_resolution=90, phi_resolution=90)
route_mesh = pv.merge(arcs)

pl = pv.Plotter()
pl.add_mesh(earth, color='lightsteelblue', smooth_shading=True, opacity=0.9)
pl.add_mesh(route_mesh, color='tomato')
pl.add_points(
    np.array(list(cities.values())),
    color='gold',
    point_size=18,
    render_points_as_spheres=True,
)
pl.add_point_labels(
    np.array(list(cities.values())),
    list(cities.keys()),
    font_size=20,
    point_size=0,
    fill_shape=False,
)
pl.show()
Total running time of the script: (0 minutes 0.621 seconds)
