Note
Go to the end to download the full example code.
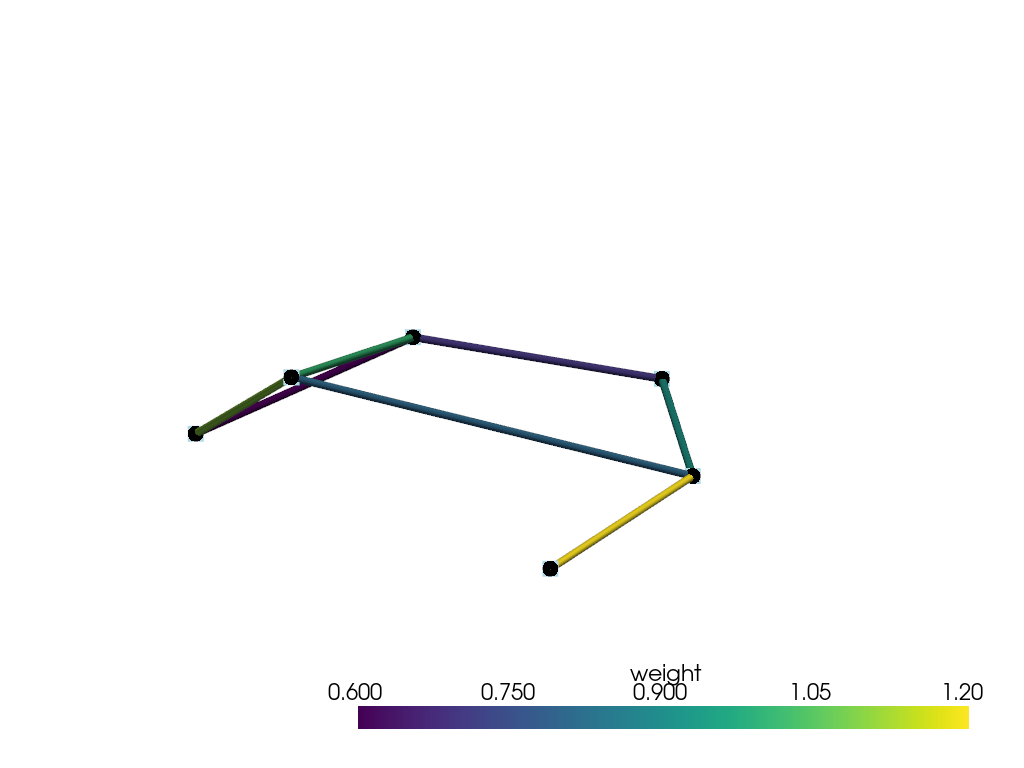
Plot a 3D Graph Network#
Render a node-edge network with labels and weighted edges using
pyvista.line_segments_from_points().
import numpy as np
import pyvista as pv
Define nodes and weighted edges#
Six labeled nodes connected by seven weighted edges.
labels = ['A', 'B', 'C', 'D', 'E', 'F']
points = np.array(
    [
        (-0.8, 0.0, 0.0),
        (-0.1, 0.7, 0.3),
        (-0.1, -0.7, 0.2),
        (0.8, 0.9, 0.6),
        (0.9, -0.1, 0.8),
        (0.8, -0.9, 0.1),
    ],
)
edges = [(0, 1), (0, 2), (1, 3), (1, 4), (2, 4), (2, 5), (4, 5)]
weights = np.array([0.9, 0.7, 1.2, 0.8, 1.0, 0.6, 1.1])

segments = np.vstack([points[[start, stop]] for start, stop in edges])
graph = pv.line_segments_from_points(segments)
graph.cell_data['weight'] = weights
Render the network#
Edges are colored by weight; node labels stay anchored to their points.
pl = pv.Plotter()
pl.add_mesh(
    graph,
    scalars='weight',
    cmap='viridis',
    line_width=8,
    render_lines_as_tubes=True,
)
pl.add_points(points, color='black', point_size=16, render_points_as_spheres=True)
pl.add_point_labels(points, labels, font_size=24, point_size=0, fill_shape=False)
pl.show()
Total running time of the script: (0 minutes 0.298 seconds)
