
lines_from_points#
- lines_from_points(
- points: VectorLikeFloat | MatrixLikeFloat,
- *,
- close: bool = False,
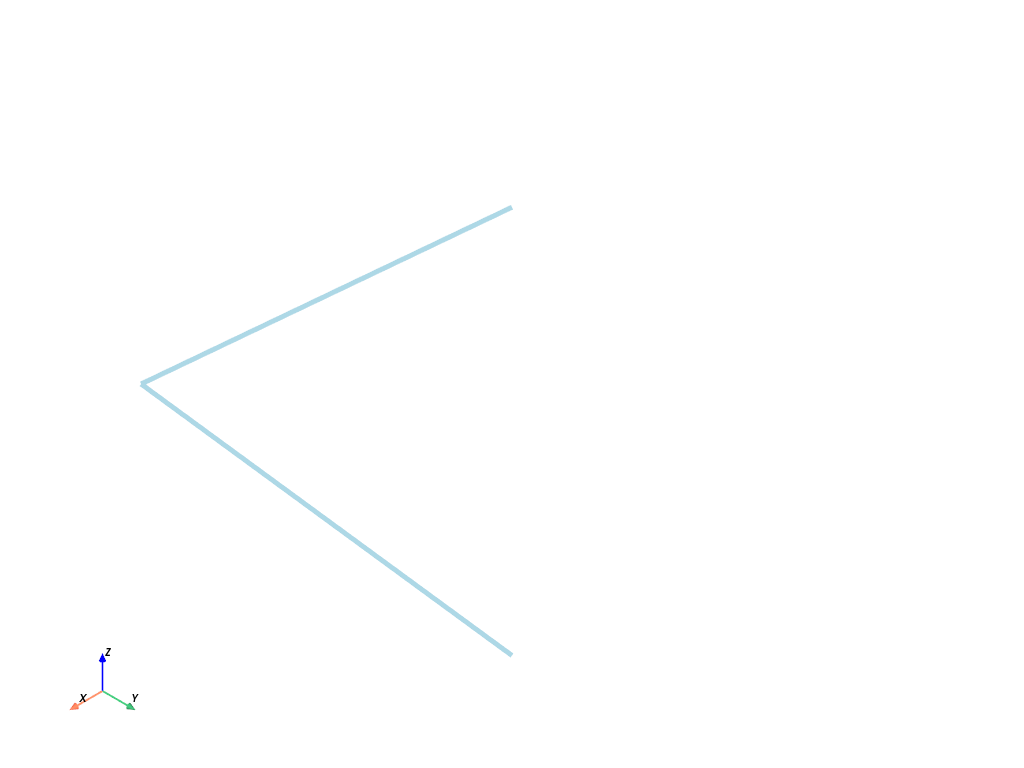
Make a connected line set given an array of points.
- Parameters:
- points
VectorLikeFloat|MatrixLikeFloat Points representing the vertices of the connected segments. For example, two line segments would be represented as
np.array([[0, 0, 0], [1, 0, 0], [1, 1, 0]]).- closebool, default:
False If
True, close the line segments into a loop.
- points
- Returns:
pyvista.PolyDataPolyData with lines and cells.
Examples#
Download Python source code | Download Jupyter notebook
See Also#
pyvista.PolyDataFilters.dash_linesSplit the line cells into dashes.
pyvista.PolyDataFilters.tubeGenerate a tube around each line.
pyvista.Actor.line_styleDash the lines while rendering them.
