ScatterPlot2D.y#
- property ScatterPlot2D.y[source]#
Retrieve the Y coordinates of this plot’s points.
Examples
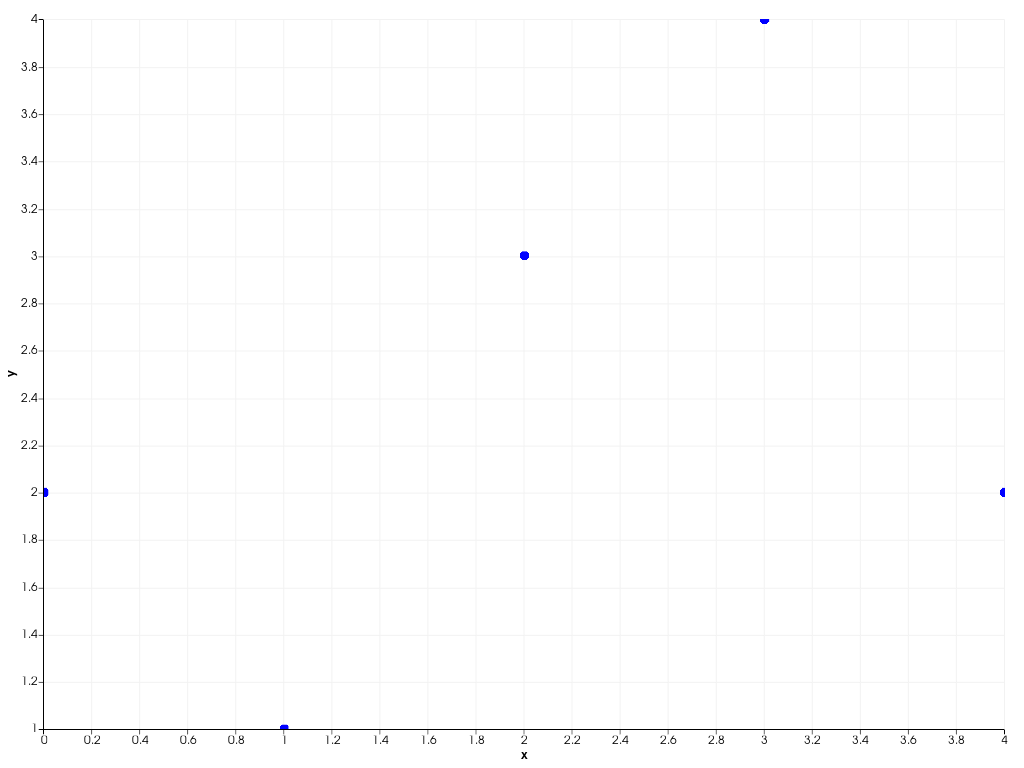
Create a scatter plot and display the y coordinates.
>>> import pyvista as pv
>>> chart = pv.Chart2D()
>>> plot = chart.scatter([0, 1, 2, 3, 4], [2, 1, 3, 4, 2])
>>> plot.y
pyvista_ndarray([2, 1, 3, 4, 2])
>>> chart.show()