PiePlot.labels#
- property PiePlot.labels[source]#
Return or set the this plot’s labels, as shown in the chart’s legend.
Examples
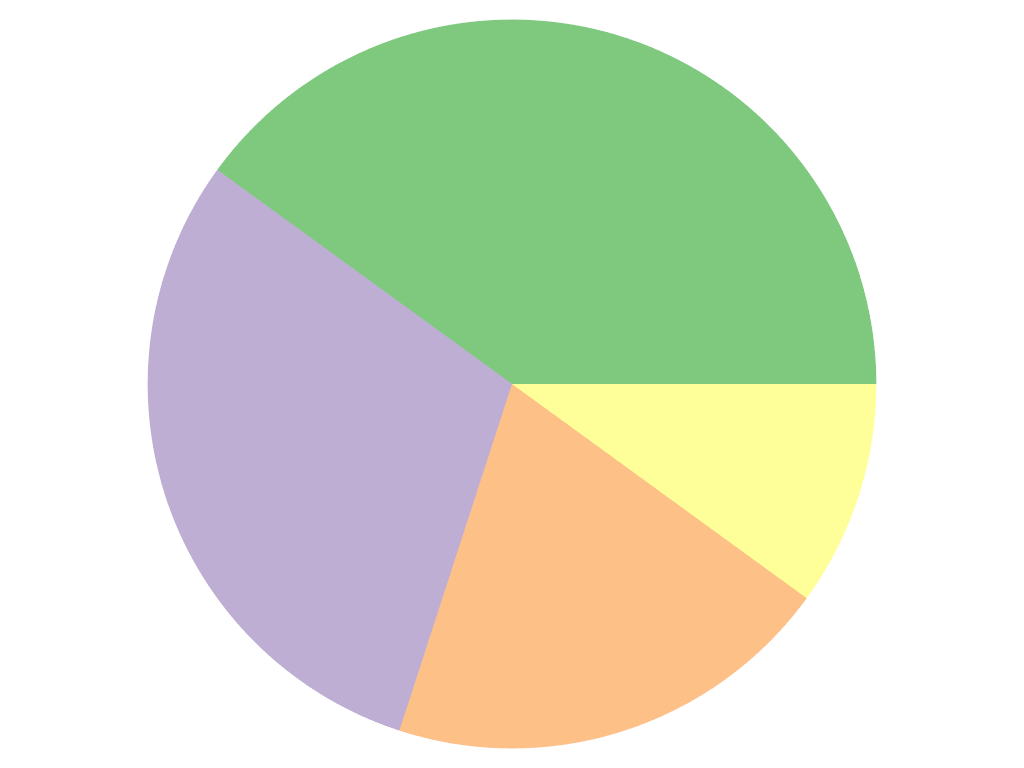
Create a pie plot.
>>> import pyvista as pv
>>> chart = pv.ChartPie([4, 3, 2, 1])
>>> plot = chart.plot
>>> chart.show()
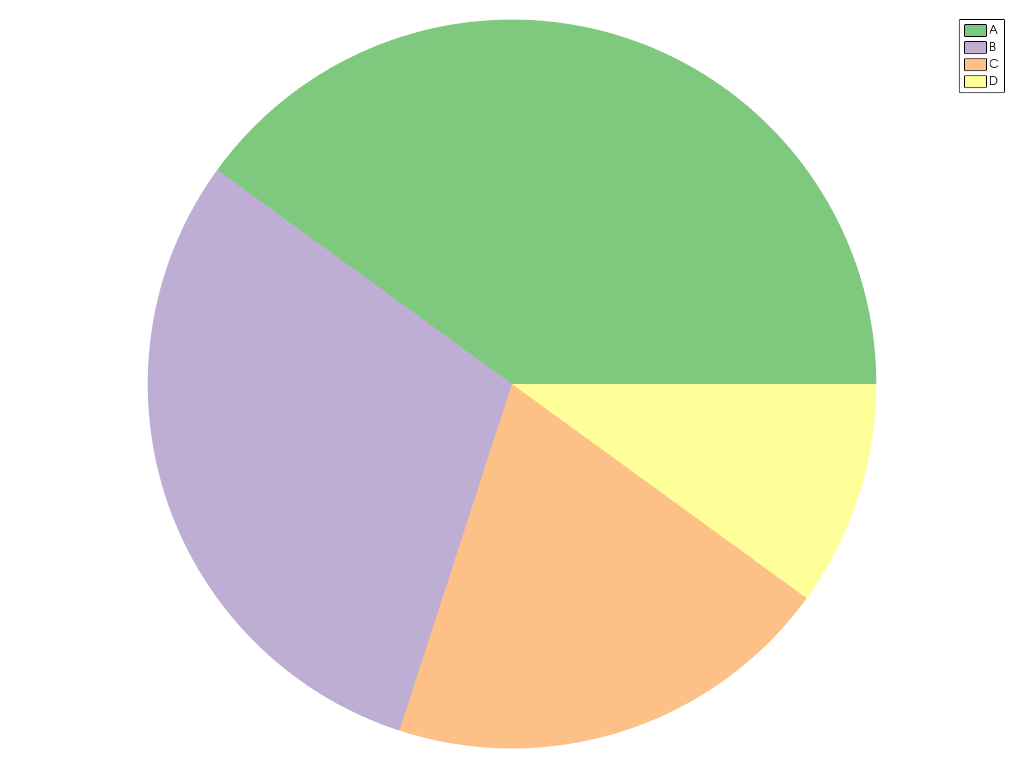
Modify the labels.
>>> plot.labels = ['A', 'B', 'C', 'D']
>>> chart.show()