ChartBox.active_border_color#
- property ChartBox.active_border_color[source]#
Return or set the chart’s border color in interactive mode.
Examples
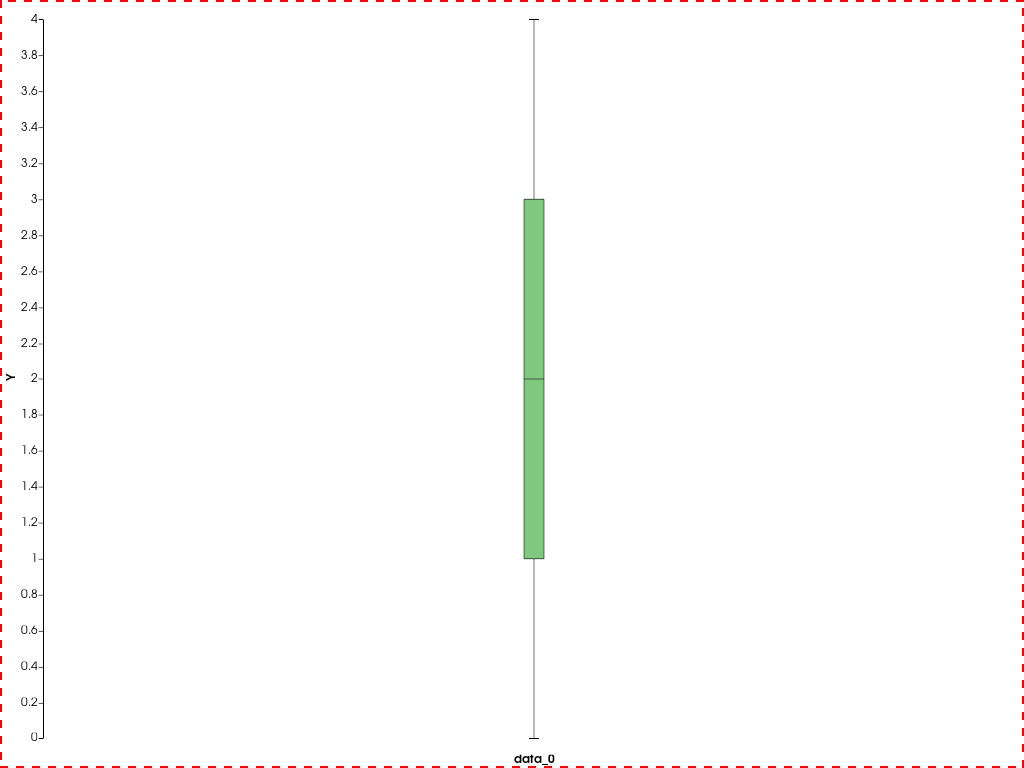
Create a boxplot chart with a thick, dashed red border.
>>> import pyvista as pv
>>> chart = pv.ChartBox([[0, 1, 1, 2, 3, 3, 4]])
>>> chart.border_color = 'r'
>>> chart.border_width = 5
>>> chart.border_style = '--'
>>> chart.show(interactive=False)
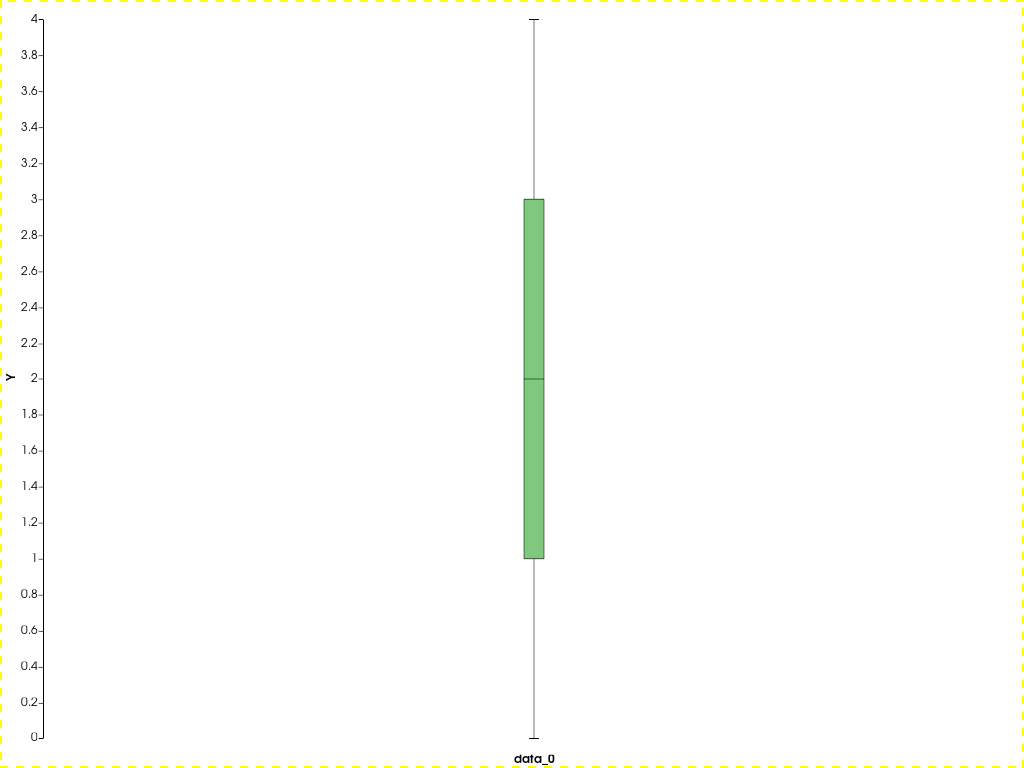
Set the active border color to yellow and activate the chart.
>>> chart.active_border_color = 'y'
>>> chart.show(interactive=True)