Chart2D.active_background_color#
- property Chart2D.active_background_color[source]#
Return or set the chart’s background color in interactive mode.
Examples
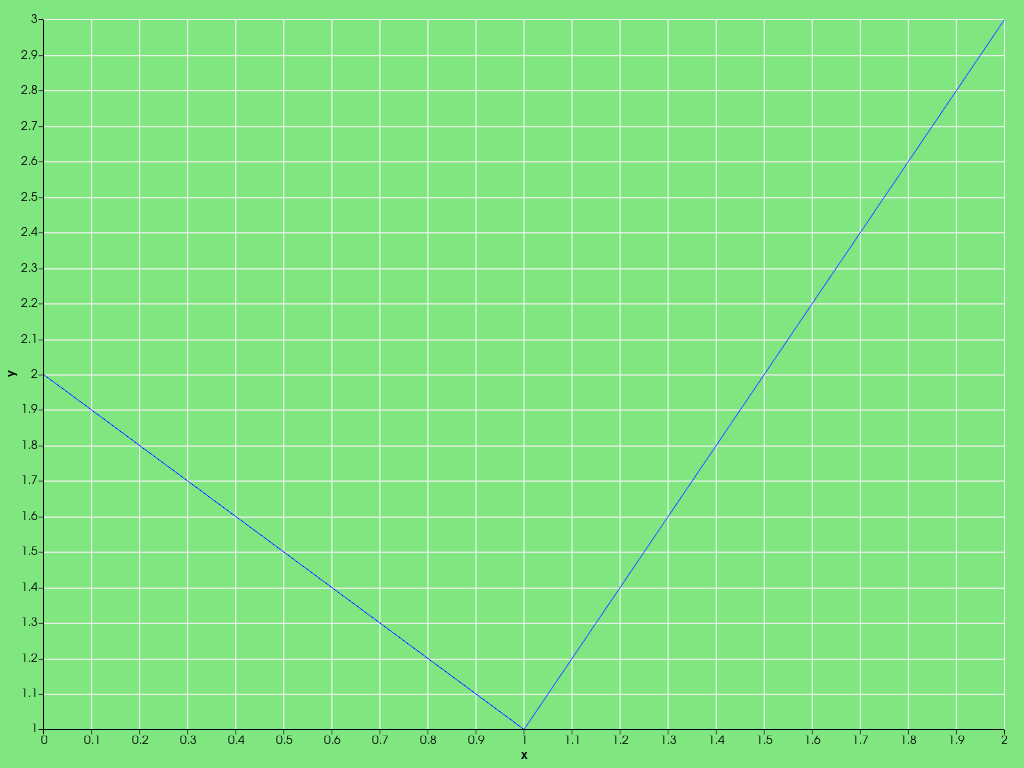
Create a 2D chart with a green background.
>>> import pyvista as pv
>>> chart = pv.Chart2D()
        >>> plot = chart.line([0, 1, 2], [2, 1, 3])
>>> chart.background_color = (0.5, 0.9, 0.5)
>>> chart.show(interactive=False)
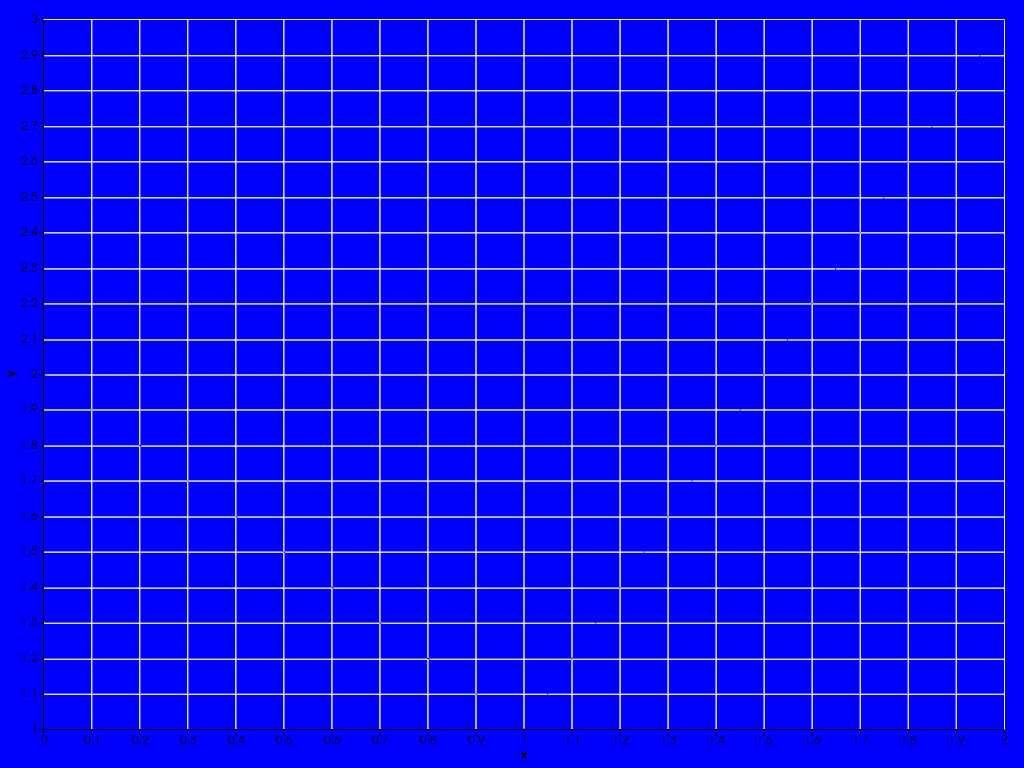
Set the active background color to blue and activate the chart.
>>> chart.active_background_color = 'b'
>>> chart.show(interactive=True)