Note
Go to the end to download the full example code.
Topographic Map#
This is very similar to the Applying Textures example except it is focused on plotting aerial imagery from a GeoTIFF on top of some topography mesh.
import matplotlib as mpl
import matplotlib.pyplot as plt
import pyvista as pv
from pyvista import examples
Start by loading the elevation data and a topographic map.
# Load the elevation data as a surface
topo = examples.download_crater_topo().resample(0.5, anti_aliasing=True)
elevation = topo.warp_by_scalar()
# Load the topographic map from a GeoTiff
topo_map = examples.download_crater_imagery()
topo_map.to_image().resample(0.5, anti_aliasing=True, inplace=True)
topo_map = topo_map.flip_y()  # flip to align to our dataset

elevation
Let’s inspect the imagery that we just loaded.
mpl.rcParams['figure.dpi'] = 500
plt.imshow(topo_map.to_array())
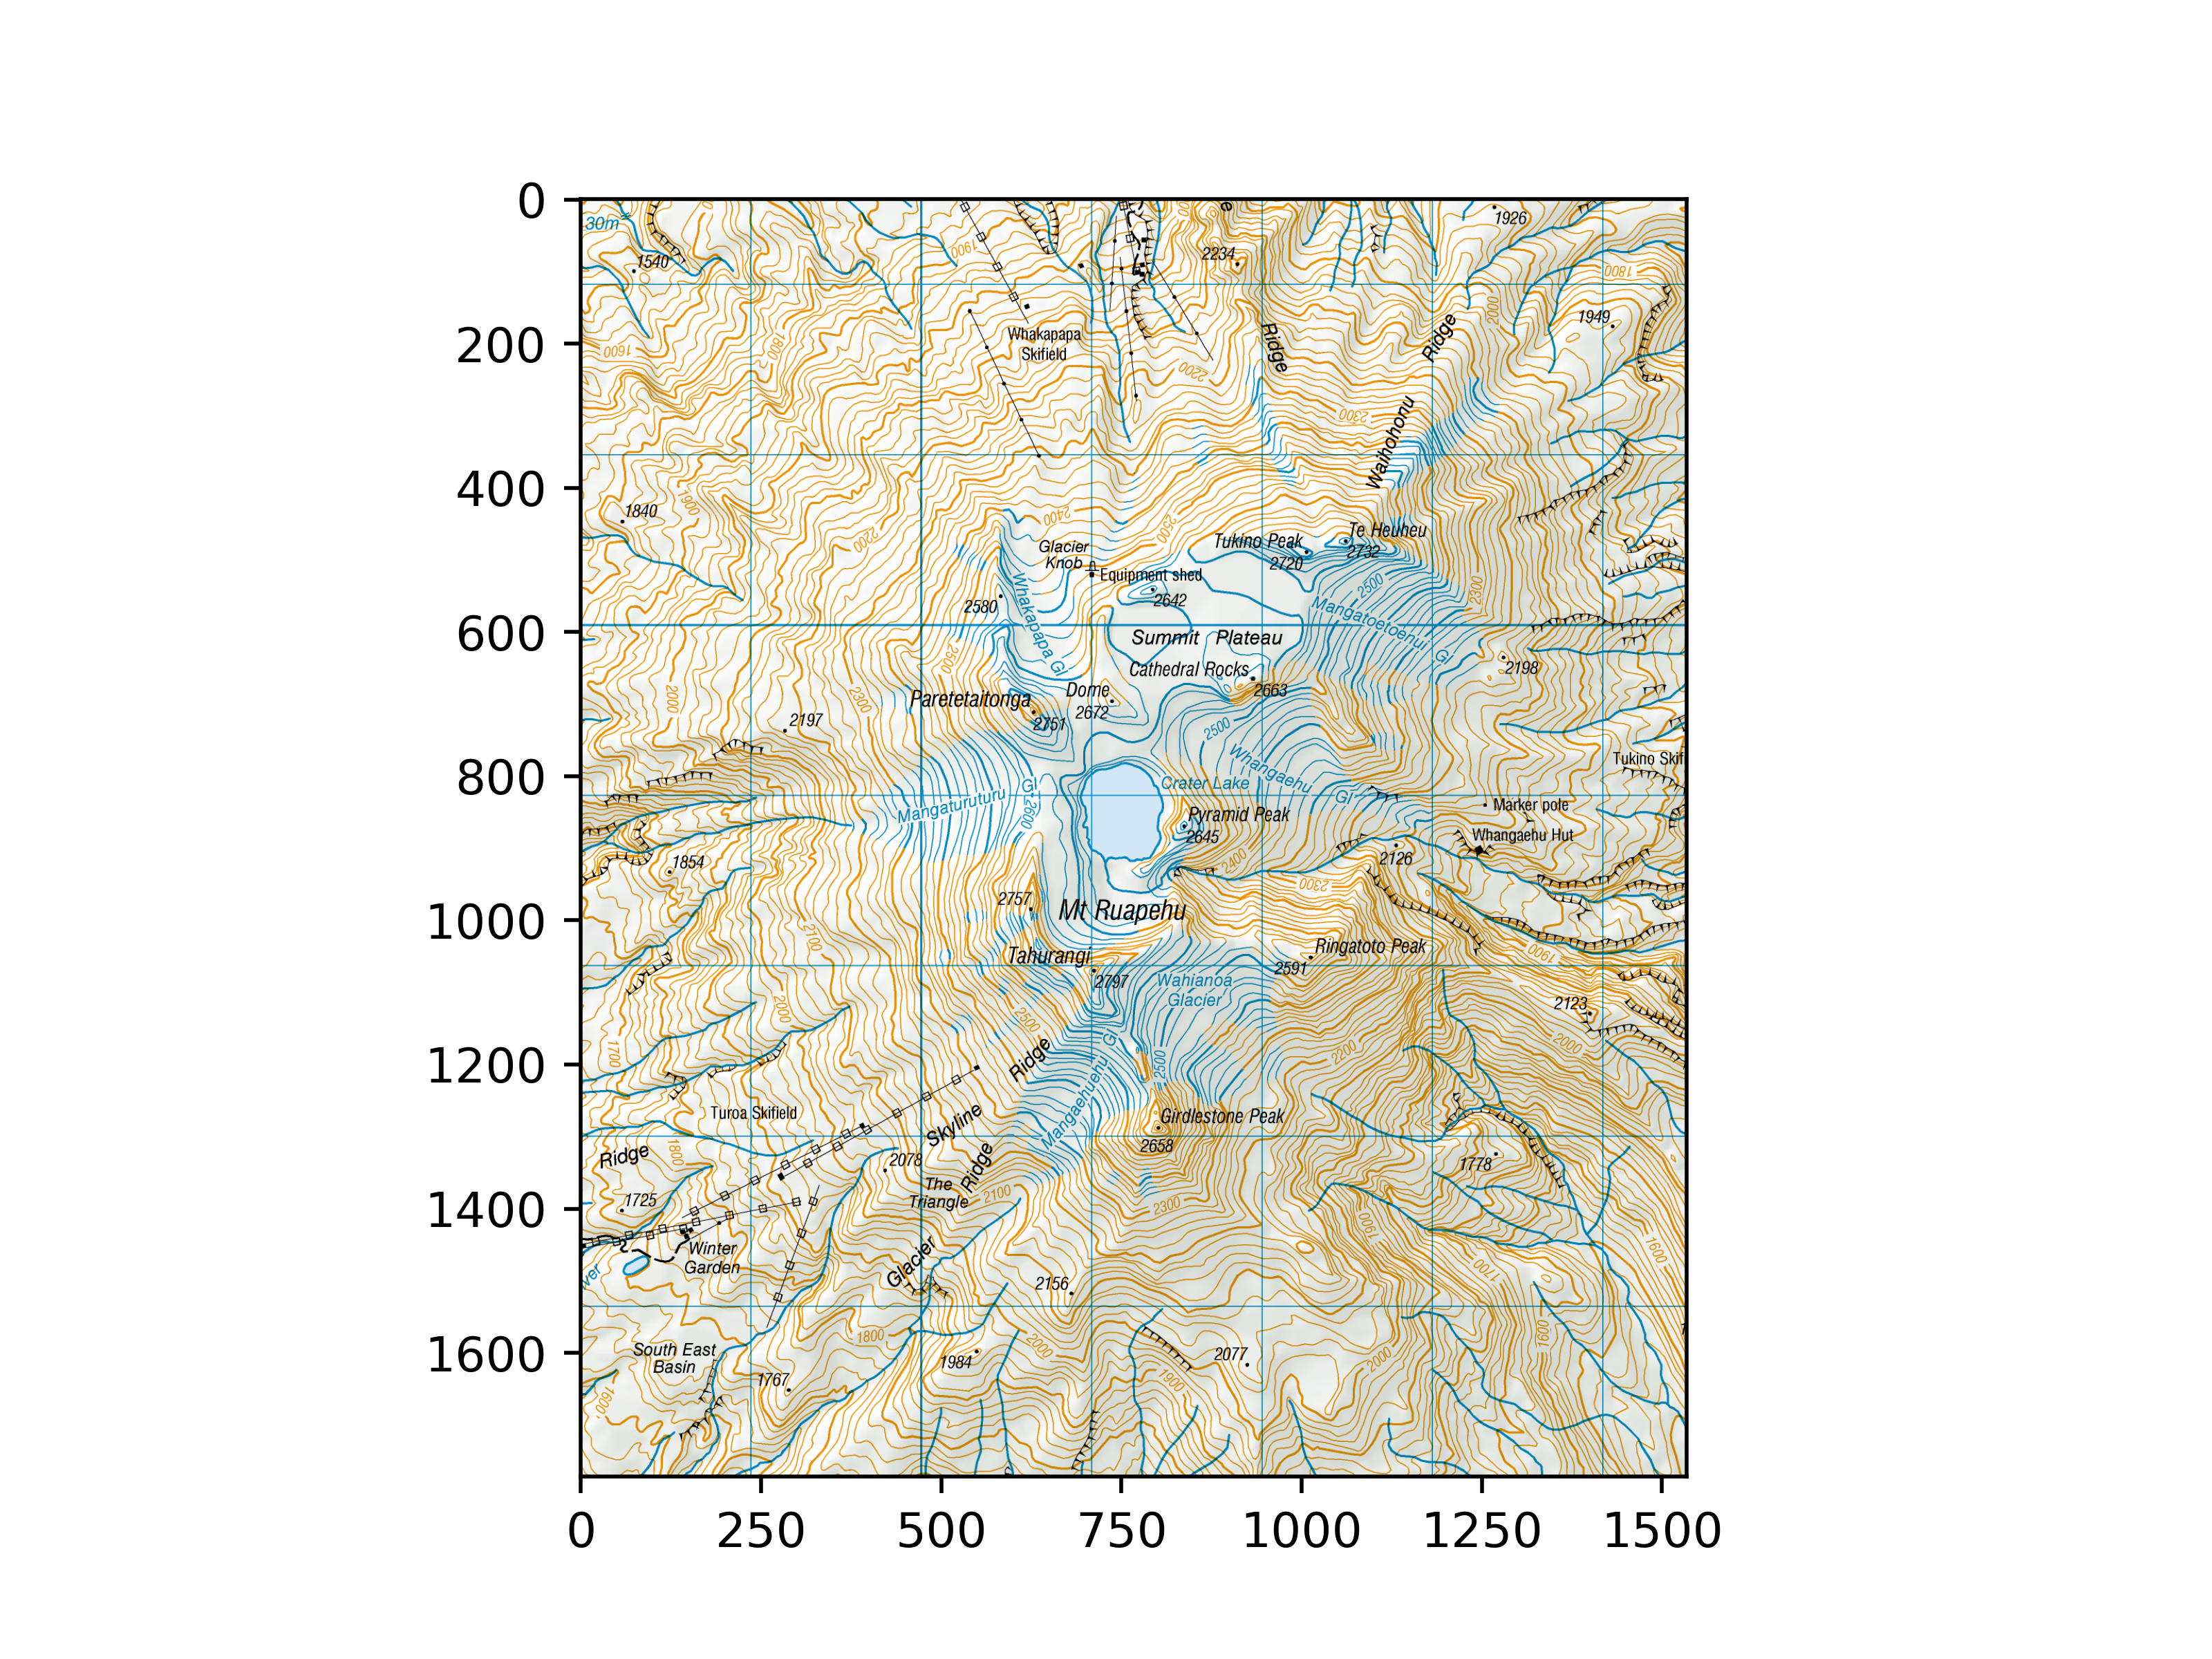
<matplotlib.image.AxesImage object at 0x7f057bf94050>
Once you have a topography mesh loaded as a surface mesh
(we use a pyvista.StructuredGrid here) and an image loaded as a
pyvista.Texture using pyvista.read_texture(),
then you can map that imagery to the surface mesh as follows:
# Bounds of the aerial imagery - given to us
bounds = (1818000, 1824500, 5645000, 5652500, 0, 3000)
# Clip the elevation dataset to the map's extent
local = elevation.clip_box(bounds, invert=False)
# Apply texturing coordinates to associate the image to the surface
local.texture_map_to_plane(use_bounds=True, inplace=True)
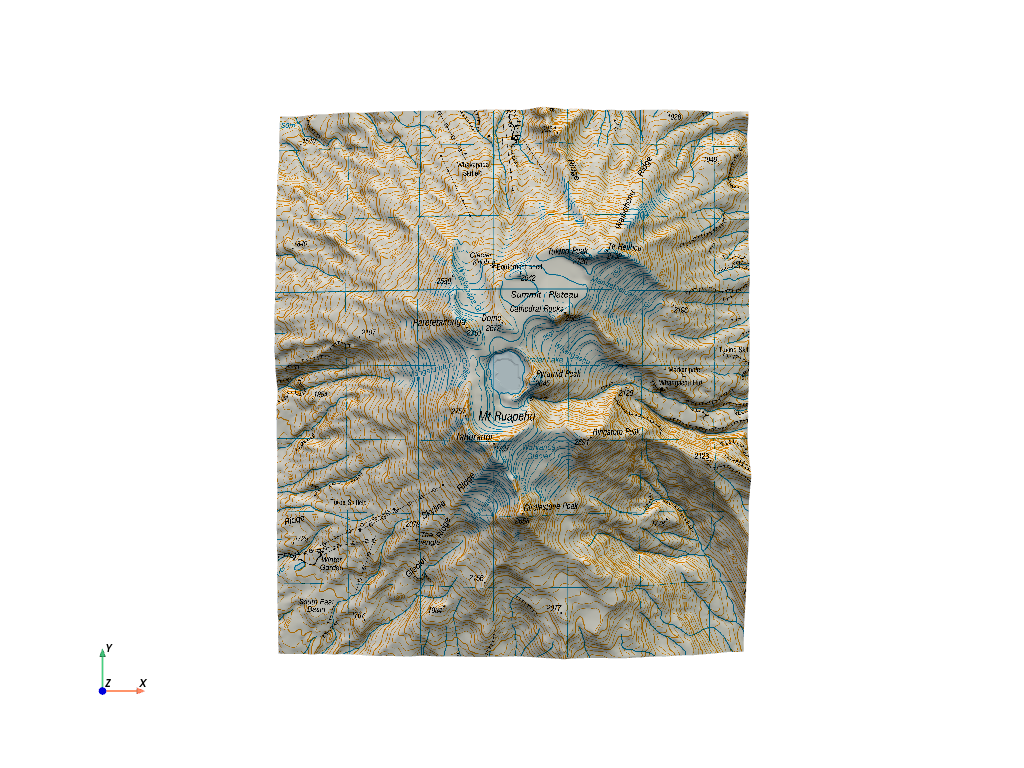
Now display it. Note that the imagery is aligned as we expect.
local.plot(texture=topo_map, cpos='xy')
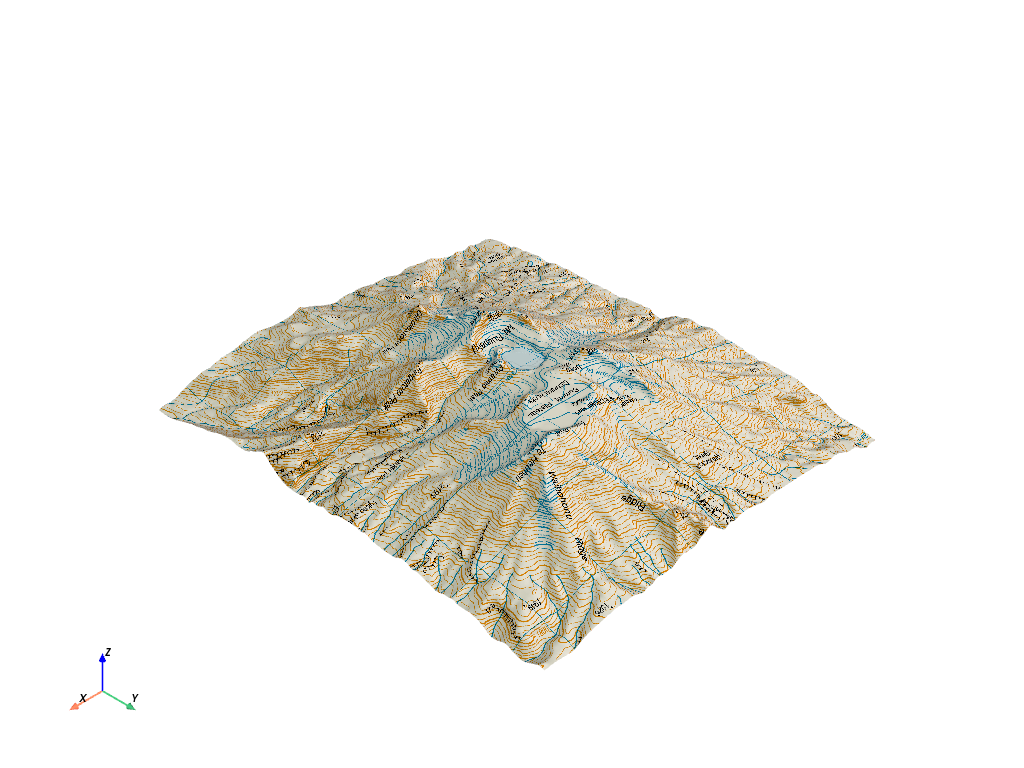
And here is a 3D perspective.
local.plot(texture=topo_map)
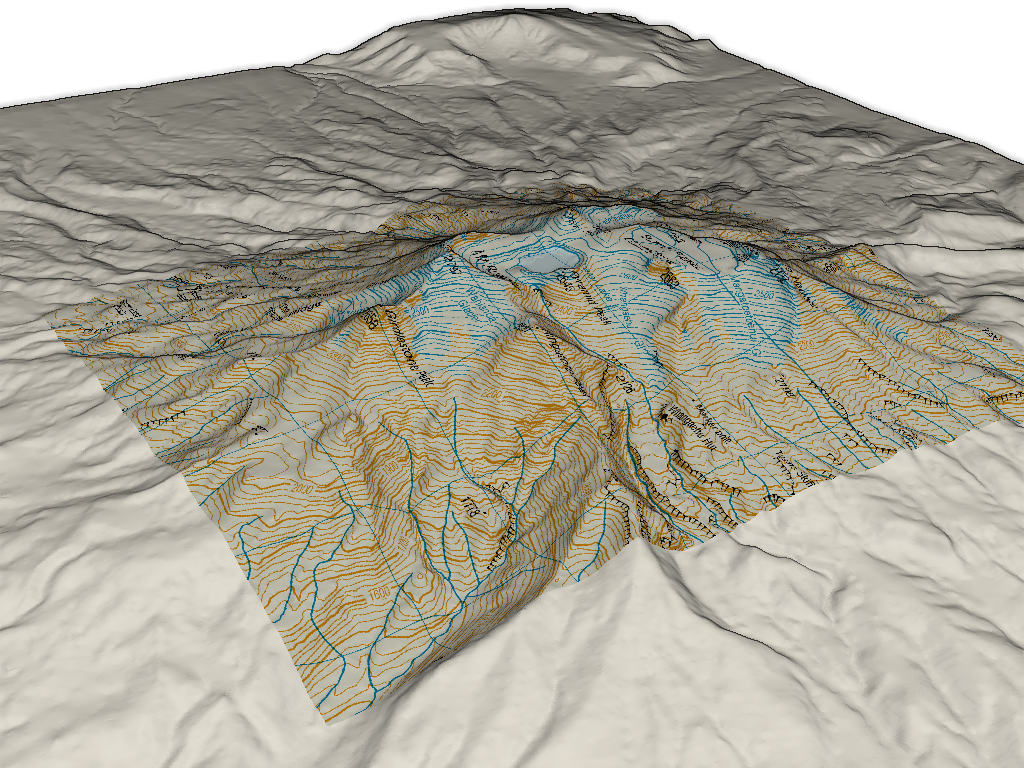
We could also display the entire region by extracting the surrounding region and plotting the texture mapped local topography and the outside area
# Extract surrounding region from elevation data
surrounding = elevation.clip_box(bounds, invert=True)

# Display with a shading technique
pl = pv.Plotter()
pl.add_mesh(local, texture=topo_map)
pl.add_mesh(surrounding, color='white')
pl.enable_eye_dome_lighting()
pl.camera_position = pv.CameraPosition(
    position=(1831100.0, 5642142.0, 8168.0),
    focal_point=(1820841.0, 5648745.0, 1104.0),
    viewup=(-0.435, 0.248, 0.865),
)
pl.show()
ERROR:root:FrameBufferObject should have been deleted in ReleaseGraphicsResources().
ERROR:root:ColorTexture should have been deleted in ReleaseGraphicsResources().
ERROR:root:DepthTexture should have been deleted in ReleaseGraphicsResources().
ERROR:root:FrameBufferObject should have been deleted in ReleaseGraphicsResources().
ERROR:root:ColorTexture should have been deleted in ReleaseGraphicsResources().
ERROR:root:FrameBufferObject should have been deleted in ReleaseGraphicsResources().
ERROR:root:ColorTexture should have been deleted in ReleaseGraphicsResources().
ERROR:root:ColorTexture should have been deleted in ReleaseGraphicsResources().
Total running time of the script: (0 minutes 7.987 seconds)
