BoxPlot.label#
- property BoxPlot.label[source]#
Return or set the this plot’s label, as shown in the chart’s legend.
Examples
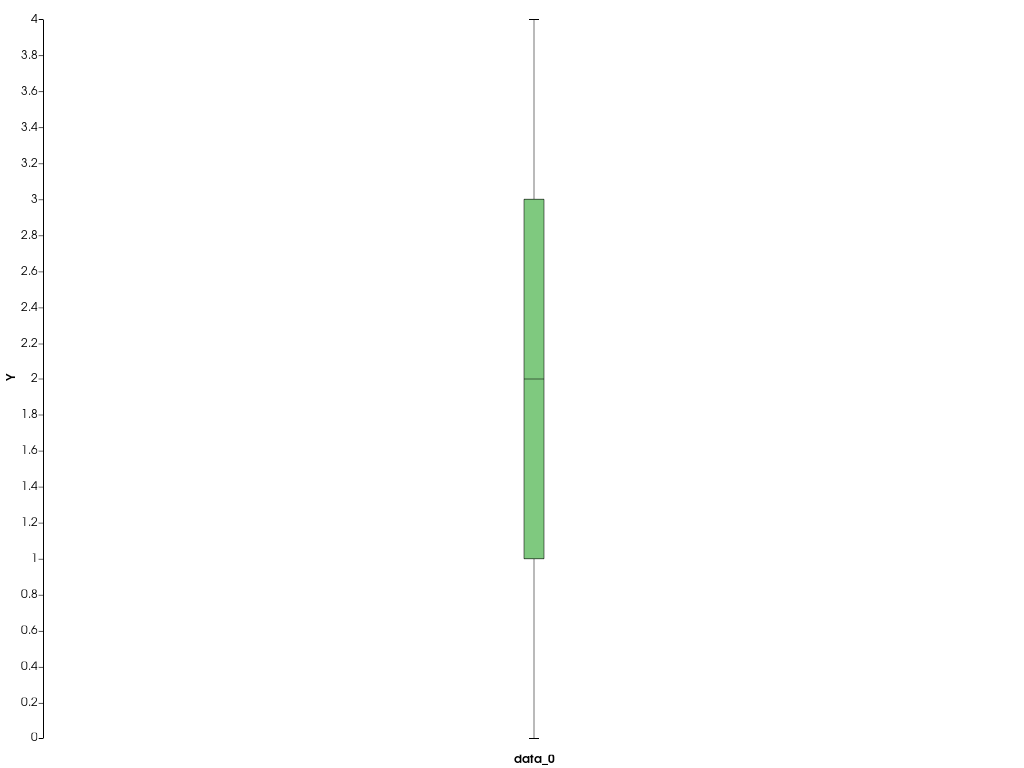
Create a box plot with custom label.
>>> import pyvista as pv
>>> import numpy as np
>>> chart = pv.ChartBox([[0, 1, 1, 2, 3, 3, 4]])
>>> plot = chart.plot
>>> chart.show()
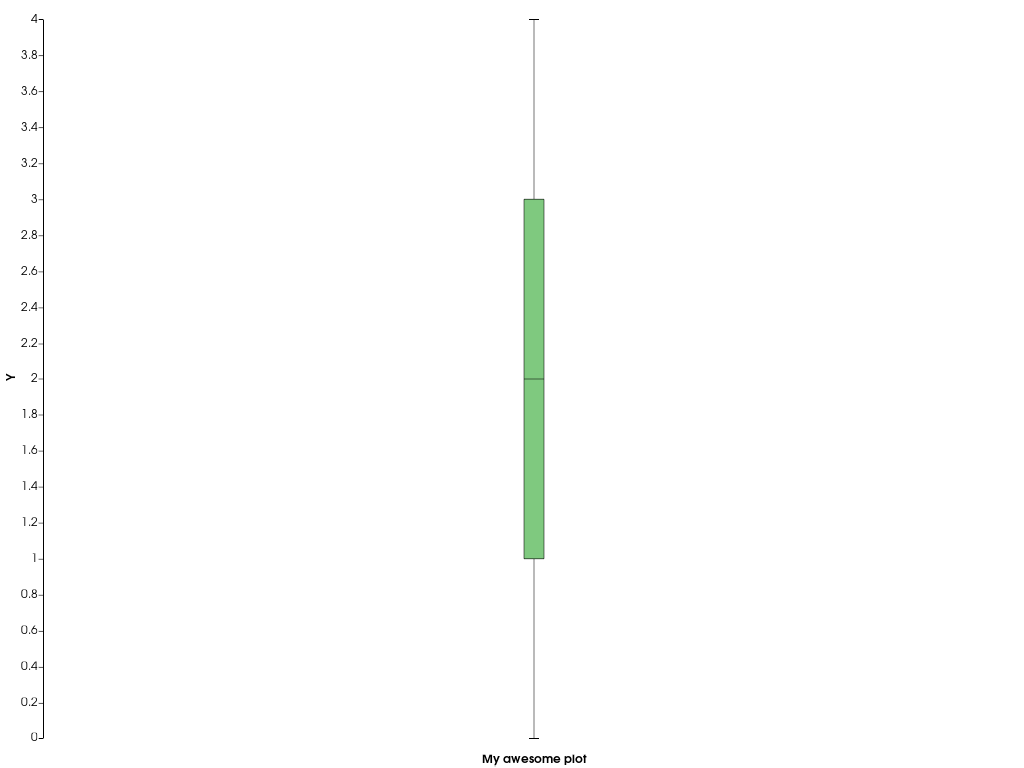
Modify the label.
>>> plot.label = 'My awesome plot'
>>> chart.show()