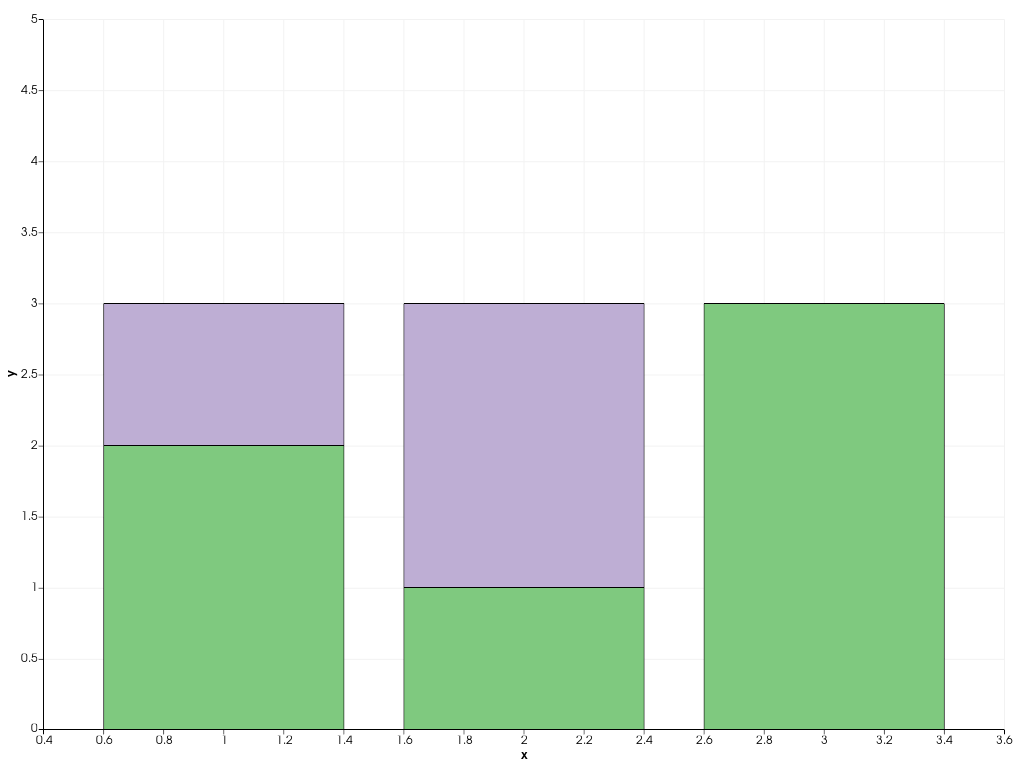
BarPlot.x# property BarPlot.x[source]# Retrieve the positions of the drawn bars. Examples Create a bar plot and display the positions. >>> import pyvista as pv >>> chart = pv.Chart2D() >>> plot = chart.bar([1, 2, 3], [[2, 1, 3], [1, 2, 0]]) >>> plot.x pyvista_ndarray([1, 2, 3]) >>> chart.show()