Note
Go to the end to download the full example code.
Compare threshold filters#
Multiple filters exist to exclude or highlight scalar values. The goal of this example is to compare some of these filters to show how each can be used. We will be differentiating them based on the input type they take, as well as the output type they produce.
import numpy as np

import pyvista as pv
from pyvista import examples
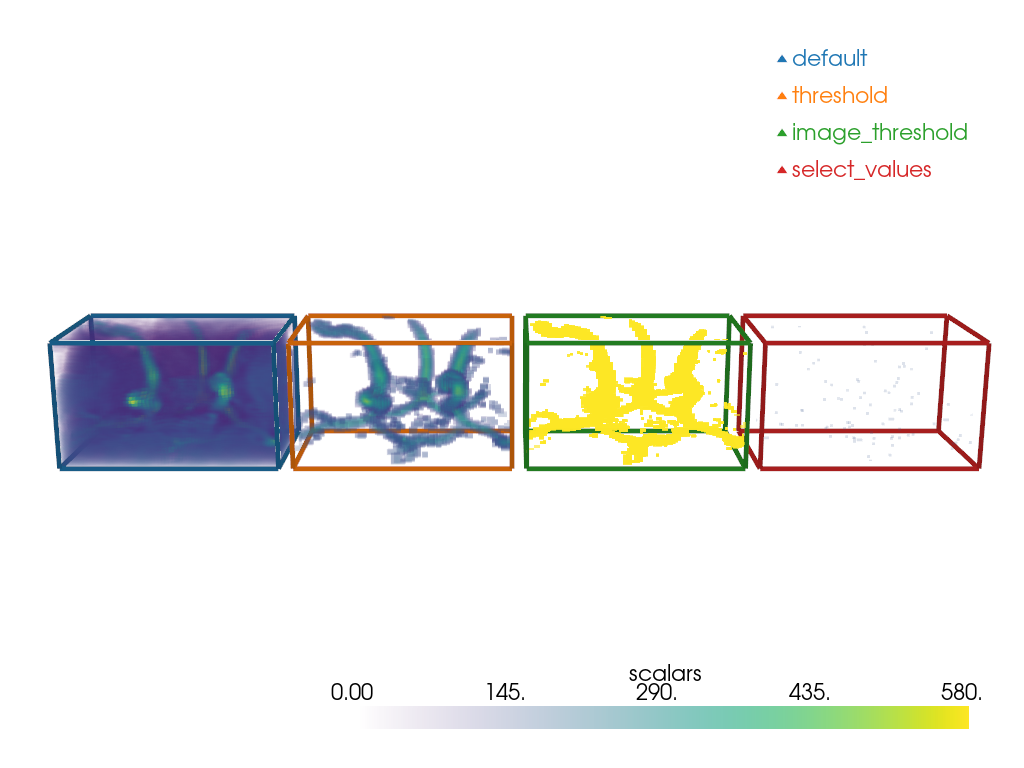
Volume Data to Volume Data#
Some filters generate pyvista.Volume out of pyvista.Volume. We will explore 3:
pyvista.DataSetFilters.threshold()
pyvista.ImageDataFilters.image_threshold()
pyvista.ImageDataFilters.select_values()
Note how pyvista.DataSetFilters.threshold keeps the dynamic
of the image for the voxels above the value
while image_threshold produces an all-or-nothing result.
Note the little specks for the select_values.
It is because it only selects the value (or values) that is (are) specified.
method_map = {'default': 0, 'threshold': 1, 'image_threshold': 2, 'select_values': 3}
step = -80
value = 155
outlines_mesh = pv.PolyData()
volume = pv.examples.download_carotid()
volume_outline = pv.Box(volume.bounds)
volume_outline.cell_data['method'] = np.full(
    (volume_outline.n_cells), method_map['default']
)
outlines_mesh += volume_outline
thresholded_vol = volume.threshold(value)
thresholded_vol = thresholded_vol.translate([step, 0, 0])
thresholded_vol_outline = pv.Box(thresholded_vol.bounds)
thresholded_vol_outline.cell_data['method'] = np.full(
    (thresholded_vol_outline.n_cells), method_map['threshold']
)
outlines_mesh += thresholded_vol_outline
image_thresholded_vol = volume.image_threshold(value, in_value=volume['scalars'].max())
image_thresholded_vol = image_thresholded_vol.translate([2 * step, 0, 0])
image_thresholded_vol_outline = pv.Box(image_thresholded_vol.bounds)
image_thresholded_vol_outline.cell_data['method'] = np.full(
    (image_thresholded_vol_outline.n_cells), method_map['image_threshold']
)
outlines_mesh += image_thresholded_vol_outline
select_values_vol = volume.select_values(value)
select_values_vol = select_values_vol.translate([3 * step, 0, 0])
select_values_vol_outline = pv.Box(select_values_vol.bounds)
select_values_vol_outline.cell_data['method'] = np.full(
    (select_values_vol_outline.n_cells), method_map['select_values']
)
outlines_mesh += select_values_vol_outline
pl = pv.Plotter()
pl.add_volume(volume)
pl.add_volume(thresholded_vol)
pl.add_volume(image_thresholded_vol)
pl.add_volume(select_values_vol)
outlines_mesh.set_active_scalars('method')
colored_outline_mesh, color_map = outlines_mesh.color_labels(
    output_scalars='method', return_dict=True
)
legend_map = dict(zip(method_map.keys(), color_map.values(), strict=True))
pl.add_mesh(colored_outline_mesh, style='wireframe', rgb=True, line_width=5)
pl.add_legend(legend_map)
cpos = pv.CameraPosition(
    position=(20, -390, -100.0), focal_point=(20, 100.0, 20.0), viewup=(0, 0, -1)
)
pl.camera_position = cpos
pl.show()
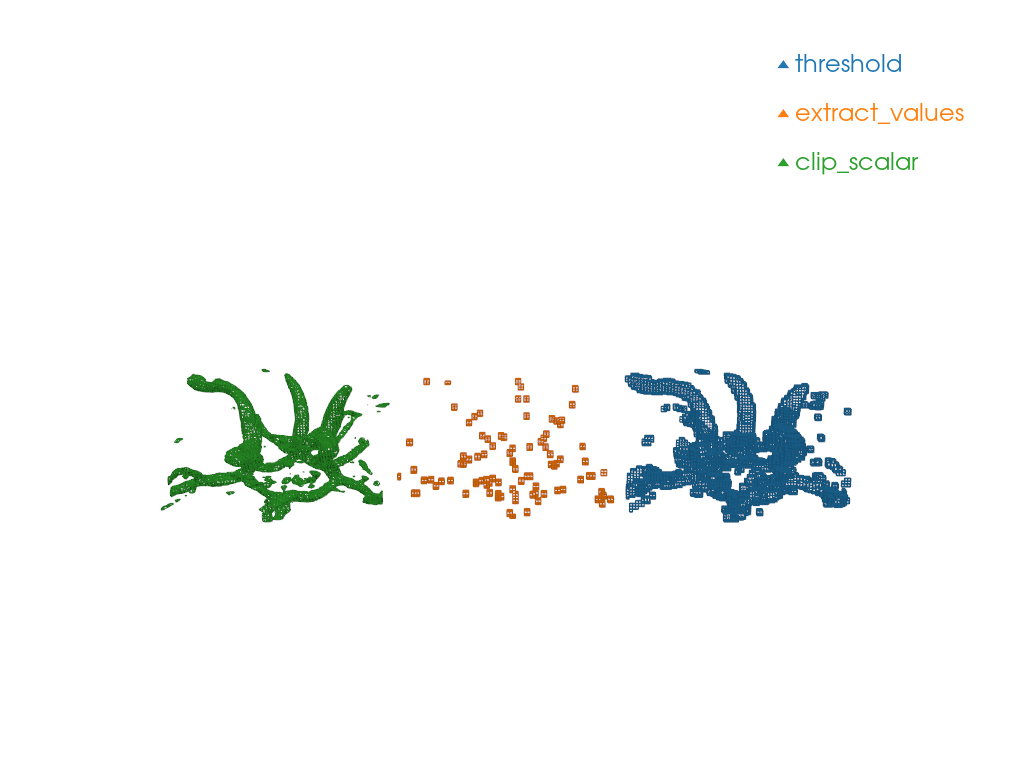
Volume Data to Unstructured Grid#
Some filters generate a pyvista.UnstructuredGrid
out of a`pyvista.Volume`.
We will explore 3:
pyvista.DataSetFilters.threshold()
pyvista.DataSetFilters.extract_values()
pyvista.DataSetFilters.clip_scalar()
Note the shape of the produced meshes.
clip_scalar produces pyvista.CellType.WEDGE
and pyvista.CellType.TETRA
while extract_values and threshold
produces pyvista.CellType.VOXEL.
method_map = {'threshold': 0, 'extract_values': 1, 'clip_scalar': 2}
volume = pv.examples.download_carotid()
step = -80
values = (155, 580)
mesh = pv.UnstructuredGrid()
pl = pv.Plotter()
clipped_vol = volume.clip_scalar(value=values)
clipped_vol.cell_data['method'] = np.full(
    (clipped_vol.number_of_cells), method_map['clip_scalar']
)
mesh += clipped_vol
extracted_values_vol = volume.extract_values(values)
extracted_values_vol.cell_data['method'] = np.full(
    (extracted_values_vol.number_of_cells), method_map['extract_values']
)
extracted_values_vol.points[:, 0] += step
mesh += extracted_values_vol

thresholded_vol = volume.threshold(values)
thresholded_vol.cell_data['method'] = np.full(
    (thresholded_vol.number_of_cells), method_map['threshold']
)
thresholded_vol.points[:, 0] += step * 2
mesh += thresholded_vol
mesh.set_active_scalars('method')
colored_mesh, color_map = mesh.color_labels(output_scalars='method', return_dict=True)
legend_map = dict(zip(method_map.keys(), color_map.values(), strict=True))
pl.add_mesh(colored_mesh, style='wireframe', rgb=True)
pl.add_legend(legend_map)
cpos = pv.CameraPosition(
    position=(55.2, -385.3, -119.1), focal_point=(55.2, 104.7, 0.9), viewup=(0, 0, -1)
)
pl.camera_position = cpos
pl.show()
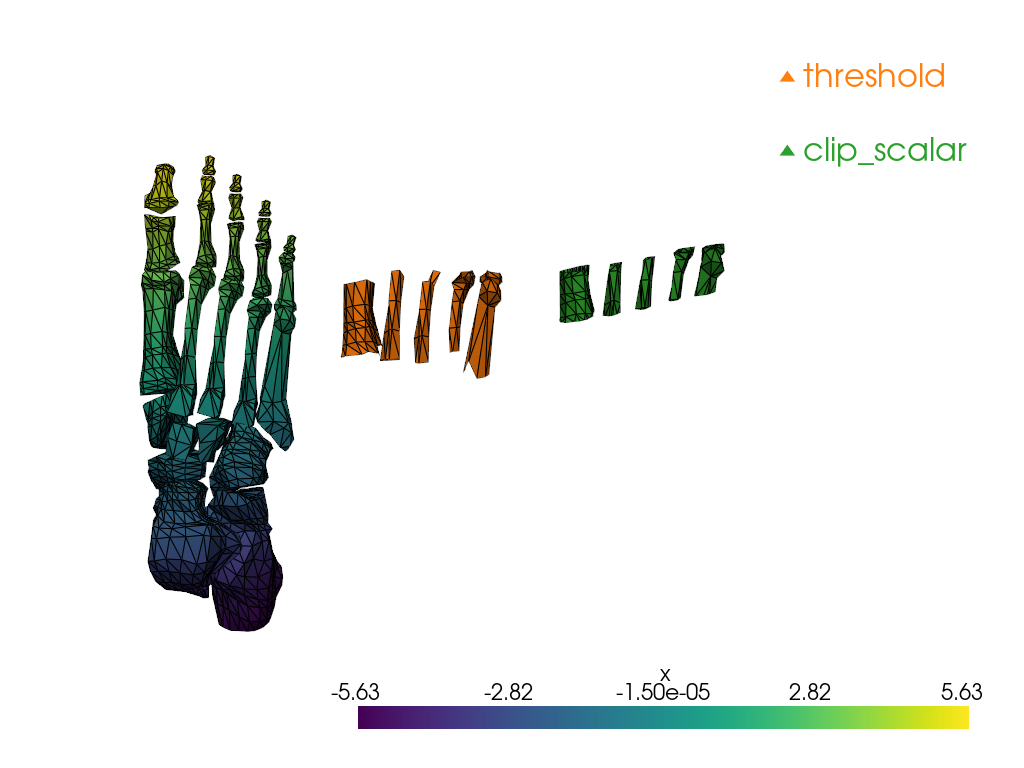
Unstructured Grid to Unstructured Grid#
Some filters generate a pyvista.UnstructuredGrid
out of a`pyvista.UnstructuredGrid`.
We will explore 2:
pyvista.DataSetFilters.threshold()
pyvista.DataSetFilters.clip_scalar()
Notice how threshold keeps the cells which correspond
to the specified value range while clip_scalar generates
a “clean” cut, which modifies the cells at the boundaries of
the clip.
values = (1, 2)
step = 5
surface = examples.download_foot_bones()
method_map = {'threshold': 1, 'clip_scalar': 2}
all_filtered_meshes = pv.UnstructuredGrid()
surface.point_data['x'] = surface.points[:, 0]
surface.set_active_scalars('x')
thresholded_surf = surface.threshold(values)
thresholded_surf.points[:, 2] += step
thresholded_surf.cell_data['method'] = np.full(
    (thresholded_surf.number_of_cells), method_map['threshold']
)
all_filtered_meshes += thresholded_surf
clipped_surf = surface.clip_scalar(value=values)
clipped_surf.points[:, 2] += 2 * step
clipped_surf.cell_data['method'] = np.full(
    (clipped_surf.number_of_cells), method_map['clip_scalar']
)
all_filtered_meshes += clipped_surf
all_filtered_meshes.set_active_scalars('method')
colored_mesh, color_map = all_filtered_meshes.color_labels(
    output_scalars='method', return_dict=True
)
legend_map = dict(zip(method_map.keys(), color_map.values(), strict=True))
pl = pv.Plotter()
pl.add_mesh(surface, show_edges=True)
pl.add_mesh(colored_mesh, rgb=True, show_edges=True)
pl.add_legend(legend_map)
cpos = pv.CameraPosition(
    position=(6.5, 29.4, 14.9), focal_point=(-1.1, -3.9, 6.0), viewup=(0.96, -0.3, 0.1)
)
pl.camera_position = cpos
pl.show()
Total running time of the script: (0 minutes 3.846 seconds)
