pyvista.ImageDataFilters.image_threshold#
- ImageDataFilters.image_threshold(threshold, in_value=1.0, out_value=0.0, scalars=None, preference='point', progress_bar=False)[source]#
Apply a threshold to scalar values in a uniform grid.
If a single value is given for threshold, scalar values above or equal to the threshold are
'in'and scalar values below the threshold are'out'. If two values are given for threshold (sequence) then values equal to or between the two values are'in'and values outside the range are'out'.If
Noneis given forin_value, scalars that are'in'will not be replaced. IfNoneis given forout_value, scalars that are'out'will not be replaced.Warning: applying this filter to cell data will send the output to a new point array with the same name, overwriting any existing point data array with the same name.
- Parameters:
- threshold
floator sequence[float] Single value or (min, max) to be used for the data threshold. If a sequence, then length must be 2. Threshold(s) for deciding which cells/points are
'in'or'out'based on scalar data.- in_value
float, default: 1.0 Scalars that match the threshold criteria for
'in'will be replaced with this.- out_value
float, default: 0.0 Scalars that match the threshold criteria for
'out'will be replaced with this.- scalars
str,optional Name of scalars to process. Defaults to currently active scalars.
- preference
str, default: “point” When scalars is specified, this is the preferred array type to search for in the dataset. Must be either
'point'or'cell'.- progress_barbool, default:
False Display a progress bar to indicate progress.
- threshold
- Returns:
pyvista.ImageDataDataset with the specified scalars thresholded.
Examples
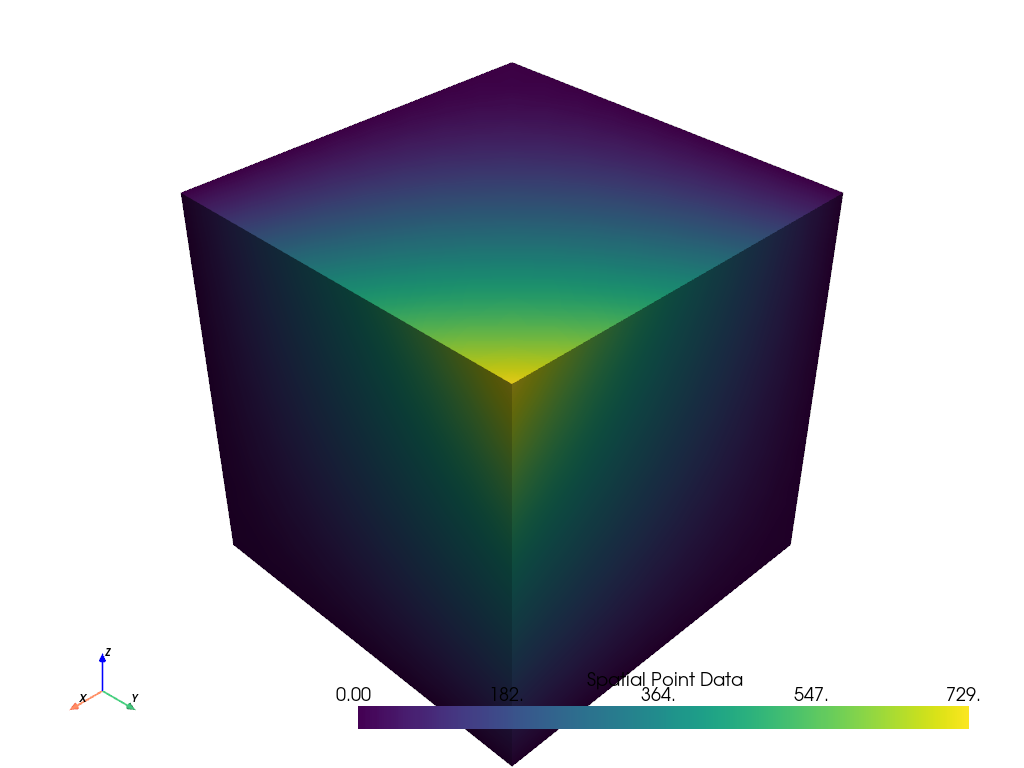
Demonstrate image threshold on an example dataset. First, plot the example dataset with the active scalars.
>>> from pyvista import examples
>>> uni = examples.load_uniform()
>>> uni.plot()
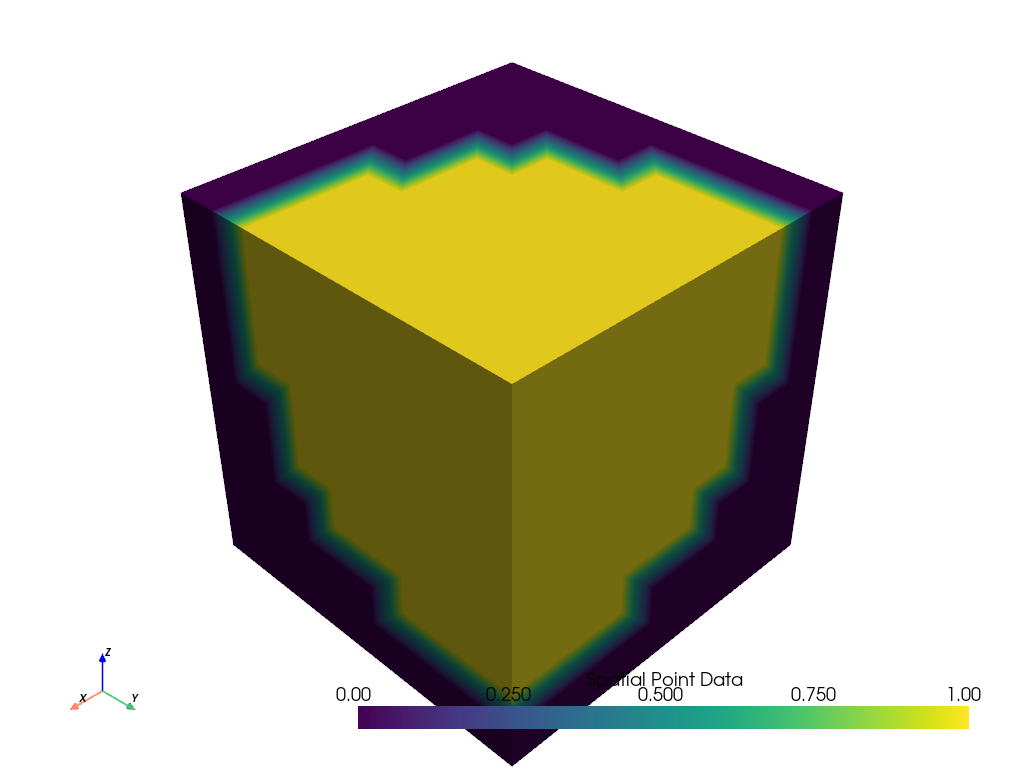
Now, plot the image threshold with
threshold=100. Note how values above the threshold are 1 and below are 0.>>> ithresh = uni.image_threshold(100) >>> ithresh.plot()