PiePlot#
- class PiePlot(chart, data, colors=None, labels=None, *, _wrap=None)[source]#
Class representing a pie plot.
Users should typically not directly create new plot instances, but use the dedicated
ChartPieclass.- Parameters:
- chart
ChartPie The chart containing this plot.
- dataarray_like
Relative size of each pie segment.
- colorssequence[
ColorLike],optional Color of the segments drawn in this plot. Any color parsable by
pyvista.Coloris allowed. If omitted (None), the default color scheme is used.- labelssequence[
str], default: [] Label for each pie segment drawn in this plot, as shown in the chart’s legend.
- chart
Examples
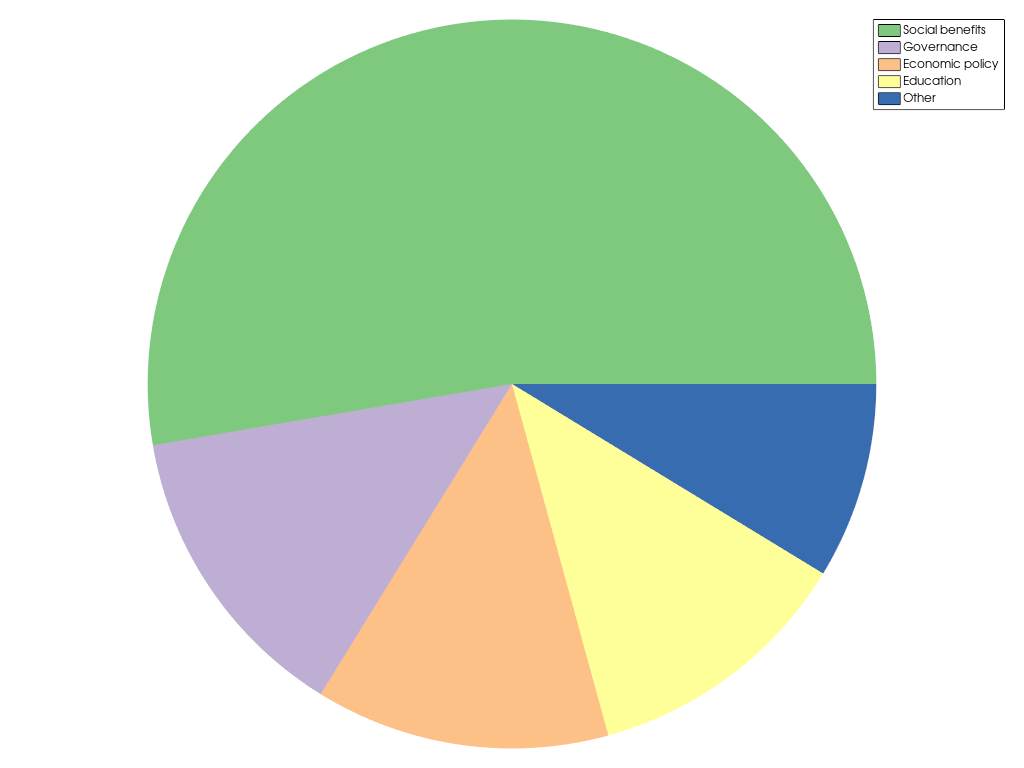
Create a pie plot showing the usage of tax money.
>>> import pyvista as pv
>>> x = [128.3, 32.9, 31.8, 29.3, 21.2]
>>> l = [
...     'Social benefits',
...     'Governance',
...     'Economic policy',
...     'Education',
...     'Other',
... ]
>>> chart = pv.ChartPie(x, labels=l)
>>> chart.show()
Methods#
Toggle the plot's visibility. |
|
|
Update the size of the pie segments. |
Attributes#
Brush object controlling how shapes in this plot are filled. |
|
Return or set the plot's color. |
|
Return or set the plot's color scheme. |
|
Return or set the plot's colors. |
|
Retrieve the sizes of the drawn segments. |
|
Return or set the this plot's label, as shown in the chart's legend. |
|
Return or set the this plot's labels, as shown in the chart's legend. |
|
Return or set the line style of all lines drawn in this plot. |
|
Return or set the line width of all lines drawn in this plot. |
|
Pen object controlling how lines in this plot are drawn. |
|
Return or set the this plot's visibility. |
