LinePlot2D#
- class LinePlot2D(*args, **kwargs)[source]#
Class representing a 2D line plot.
Users should typically not directly create new plot instances, but use the dedicated 2D chart’s plotting methods.
- Parameters:
- chart
Chart2D The chart containing this plot.
- xarray_like
X coordinates of the points through which a line should be drawn.
- yarray_like
Y coordinates of the points through which a line should be drawn.
- color
ColorLike, default: “b” Color of the line drawn in this plot. Any color parsable by
pyvista.Coloris allowed.- width
float, default: 1 Width of the line drawn in this plot.
- style
str, default: “-” Style of the line drawn in this plot. See Pen.LINE_STYLES for a list of allowed line styles.
- label
str, default: “” Label of this plot, as shown in the chart’s legend.
- chart
Examples
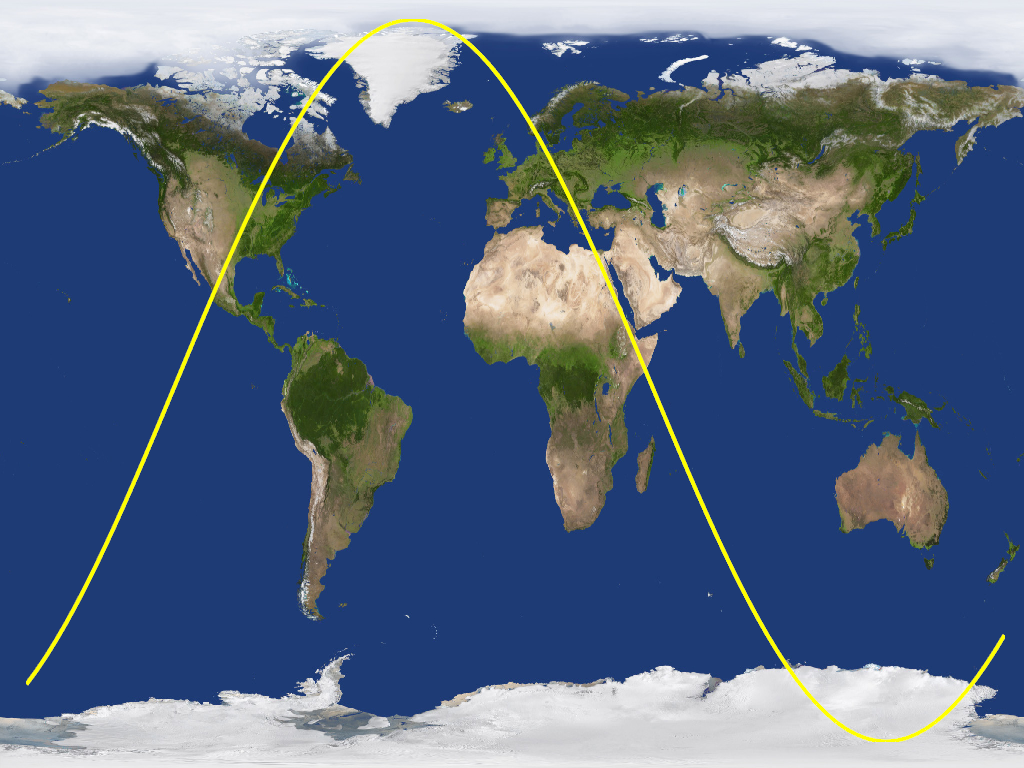
Create a 2D chart plotting an approximate satellite trajectory.
>>> import pyvista as pv
>>> from pyvista import examples
>>> import numpy as np
>>> chart = pv.Chart2D()
>>> x = np.linspace(0, 1, 100)
>>> y = np.sin(6.5 * x - 1)
>>> _ = chart.line(x, y, color='y', width=4)
>>> chart.background_texture = examples.load_globe_texture()
>>> chart.hide_axes()
>>> chart.show()
Methods#
Toggle the plot's visibility. |
|
|
Update this plot's points, through which a line is drawn. |
Attributes#
Brush object controlling how shapes in this plot are filled. |
|
Return or set the plot's color. |
|
Return or set the this plot's label, as shown in the chart's legend. |
|
Return or set the line style of all lines drawn in this plot. |
|
Return or set the line width of all lines drawn in this plot. |
|
Pen object controlling how lines in this plot are drawn. |
|
Return or set the this plot's visibility. |
|
Retrieve the X coordinates of the points through which a line is drawn. |
|
Retrieve the Y coordinates of the points through which a line is drawn. |
