BarPlot.color#
- property BarPlot.color[source]#
Return or set the plot’s color.
This is the color used by the plot’s brush to draw the different components.
Examples
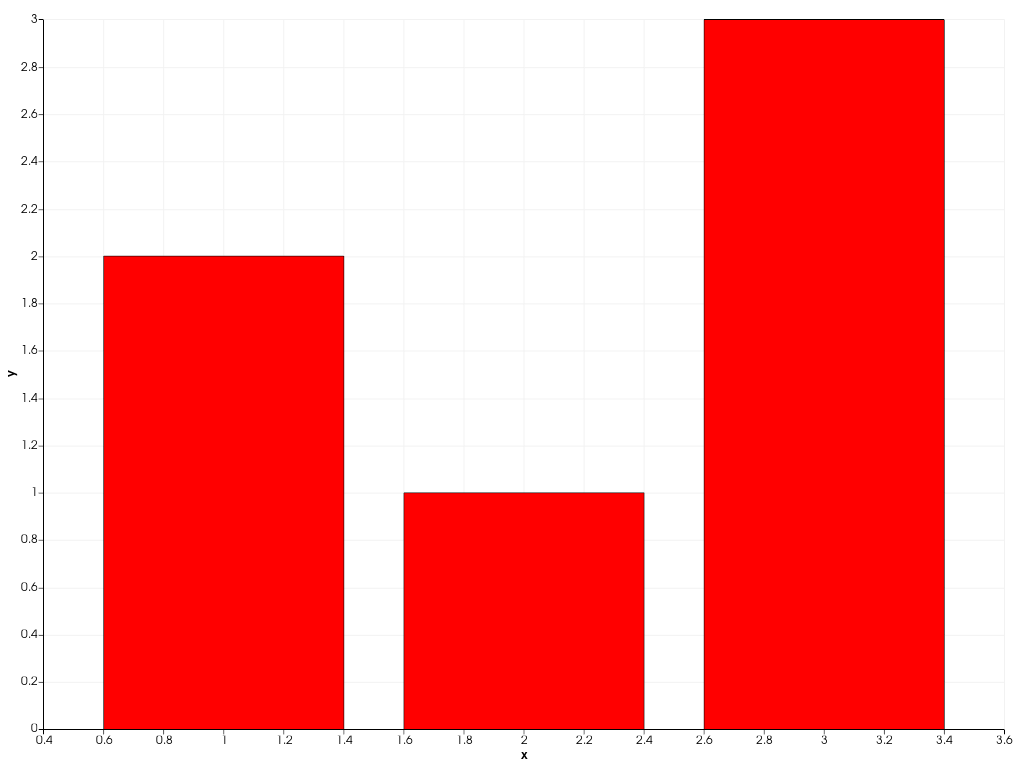
Set the bar plot’s color to red.
>>> import pyvista as pv
>>> chart = pv.Chart2D()
>>> plot = chart.bar([1, 2, 3], [2, 1, 3])
>>> plot.color = 'r'
>>> chart.show()