Chart2D.show#
- Chart2D.show(
- *,
- interactive: bool = True,
- off_screen=None,
- full_screen=None,
- screenshot=None,
- window_size=None,
- notebook=None,
- background='w',
- dev_kwargs=None,
Show this chart in a self contained plotter.
- Parameters:
- interactivebool, default:
True Enable interaction with the chart. Interaction is not enabled when plotting off screen.
- off_screenbool, optional
Plots off screen when
True. Helpful for saving screenshots without a window popping up. Defaults to active theme setting.- full_screenbool, optional
Opens window in full screen. When enabled, ignores
window_size. Defaults to active theme setting.- screenshot
str| bool, default:False Saves screenshot to file when enabled. See:
Plotter.screenshot().When
True, takes screenshot and returnsnumpyarray of image.- window_size
list, optional Window size in pixels. Defaults to active theme setting.
- notebookbool, optional
When
True, the resulting plot is placed inline a jupyter notebook. Assumes a jupyter console is active.- background
ColorLike, default: “w” Use to make the entire mesh have a single solid color. Either a string, RGB list, or hex color string. For example:
color='white',color='w',color=[1.0, 1.0, 1.0], orcolor='#FFFFFF'.- dev_kwargs
dict, optional Optional developer keyword arguments.
- interactivebool, default:
- Returns:
np.ndarrayNumPy array of the last image when
screenshot=Trueis set. Optionally contains alpha values. Sized:[Window height x Window width x 3] if the theme sets
transparent_background=False.[Window height x Window width x 4] if the theme sets
transparent_background=True.
Examples#
Download Python source code | Download Jupyter notebook
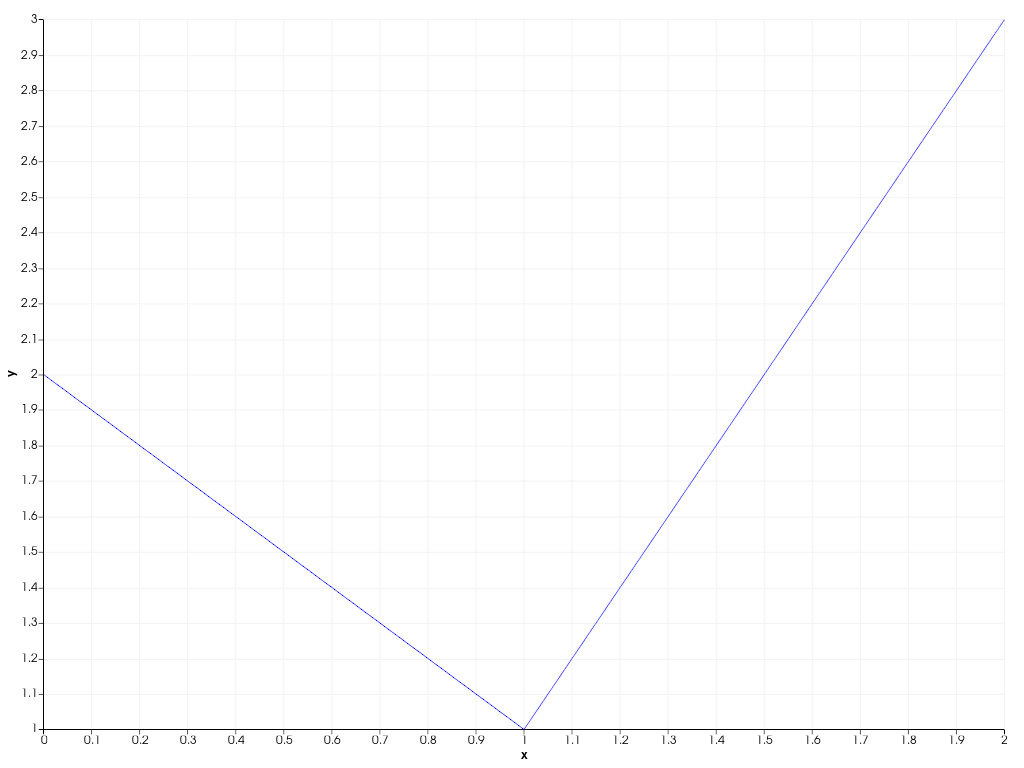
Create a simple 2D chart and show it.
>>> import pyvista as pv
>>> chart = pv.Chart2D()
        >>> plot = chart.line([0, 1, 2], [2, 1, 3])
>>> chart.show()
Used In#
API Examples
AreaPlot(1 use)AreaPlot.brush(1 use)AreaPlot.color(1 use)AreaPlot.label(1 use)AreaPlot.line_style(1 use)124 more
AreaPlot.line_width(1 use)AreaPlot.pen(1 use)AreaPlot.toggle(1 use)AreaPlot.update(1 use)AreaPlot.visible(1 use)AreaPlot.x(1 use)AreaPlot.y1(1 use)AreaPlot.y2(1 use)Axis.behavior(1 use)Axis.grid(1 use)Axis.grid_pen(1 use)Axis.label(1 use)Axis.label_size(1 use)Axis.label_visible(1 use)Axis.log_scale(1 use)Axis.margin(1 use)Axis.pen(1 use)Axis.range(1 use)Axis.tick_count(1 use)Axis.tick_label_size(1 use)Axis.tick_labels(1 use)Axis.tick_labels_offset(1 use)Axis.tick_labels_visible(1 use)Axis.tick_locations(1 use)Axis.tick_size(1 use)Axis.ticks_visible(1 use)Axis.toggle(1 use)Axis.visible(1 use)BarPlot(1 use)BarPlot.brush(1 use)BarPlot.color(1 use)BarPlot.color_scheme(1 use)BarPlot.colors(1 use)BarPlot.label(1 use)BarPlot.labels(1 use)BarPlot.line_style(1 use)BarPlot.line_width(1 use)BarPlot.orientation(1 use)BarPlot.pen(1 use)BarPlot.toggle(1 use)BarPlot.update(1 use)BarPlot.visible(1 use)BarPlot.x(1 use)BarPlot.y(1 use)Brush.color(1 use)Brush.texture(1 use)Brush.texture_interpolate(1 use)Brush.texture_repeat(1 use)Chart2D(1 use)Chart2D.active_background_color(1 use)Chart2D.active_border_color(1 use)Chart2D.area(1 use)Chart2D.background_color(1 use)Chart2D.background_texture(1 use)Chart2D.bar(1 use)Chart2D.border_color(1 use)Chart2D.border_style(1 use)Chart2D.border_width(1 use)Chart2D.clear(1 use)Chart2D.grid(1 use)Chart2D.hide_axes(1 use)Chart2D.legend(1 use)Chart2D.legend_visible(1 use)Chart2D.line(1 use)Chart2D.loc(1 use)Chart2D.plot(1 use)Chart2D.plots(1 use)Chart2D.remove_plot(1 use)Chart2D.scatter(1 use)Chart2D.size(1 use)Chart2D.stack(1 use)Chart2D.title(1 use)Chart2D.toggle(1 use)Chart2D.visible(1 use)Chart2D.x_axis(1 use)Chart2D.x_label(1 use)Chart2D.x_range(1 use)Chart2D.y_axis(1 use)Chart2D.y_label(1 use)Chart2D.y_range(1 use)LinePlot2D(1 use)LinePlot2D.brush(1 use)LinePlot2D.color(1 use)LinePlot2D.label(1 use)LinePlot2D.line_style(1 use)LinePlot2D.line_width(1 use)LinePlot2D.pen(1 use)LinePlot2D.toggle(1 use)LinePlot2D.update(1 use)LinePlot2D.visible(1 use)LinePlot2D.x(1 use)LinePlot2D.y(1 use)Pen.color(1 use)Pen.style(1 use)Pen.width(1 use)ScatterPlot2D(1 use)ScatterPlot2D.brush(1 use)ScatterPlot2D.color(1 use)ScatterPlot2D.label(1 use)ScatterPlot2D.line_style(1 use)ScatterPlot2D.line_width(1 use)ScatterPlot2D.marker_size(1 use)ScatterPlot2D.marker_style(1 use)ScatterPlot2D.pen(1 use)ScatterPlot2D.toggle(1 use)ScatterPlot2D.update(1 use)ScatterPlot2D.visible(1 use)ScatterPlot2D.x(1 use)ScatterPlot2D.y(1 use)StackPlot(1 use)StackPlot.brush(1 use)StackPlot.color(1 use)StackPlot.color_scheme(1 use)StackPlot.colors(1 use)StackPlot.label(1 use)StackPlot.labels(1 use)StackPlot.line_style(1 use)StackPlot.line_width(1 use)StackPlot.pen(1 use)StackPlot.toggle(1 use)StackPlot.update(1 use)StackPlot.visible(1 use)StackPlot.x(1 use)StackPlot.ys(1 use)
Gallery Examples