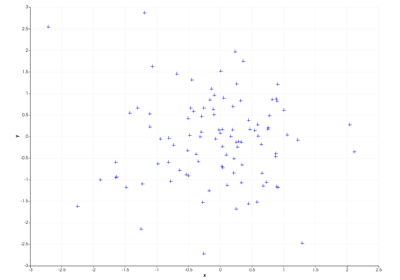
Chart2D.grid#
Examples#
Download Python source code | Download Jupyter notebook
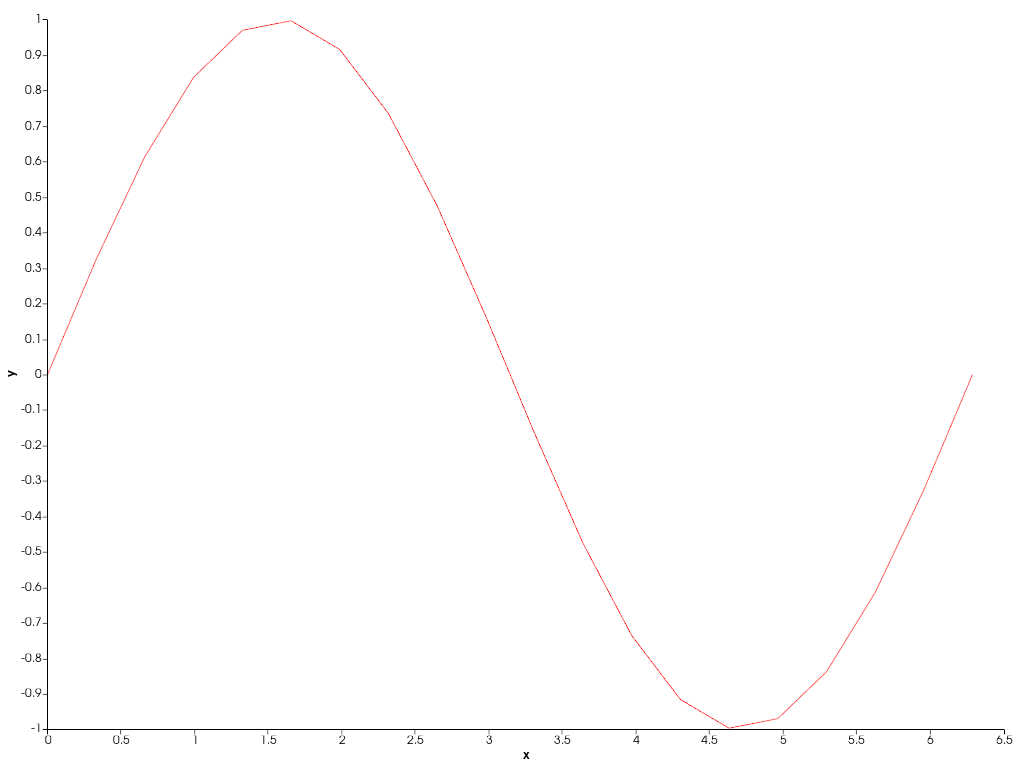
Create a 2D chart with the grid disabled.
>>> import pyvista as pv
>>> import numpy as np
>>> x = np.linspace(0, 2 * np.pi, 20)
>>> y = np.sin(x)
>>> chart = pv.Chart2D()
>>> _ = chart.line(x, y, color='r')
>>> chart.grid = False
>>> chart.show()
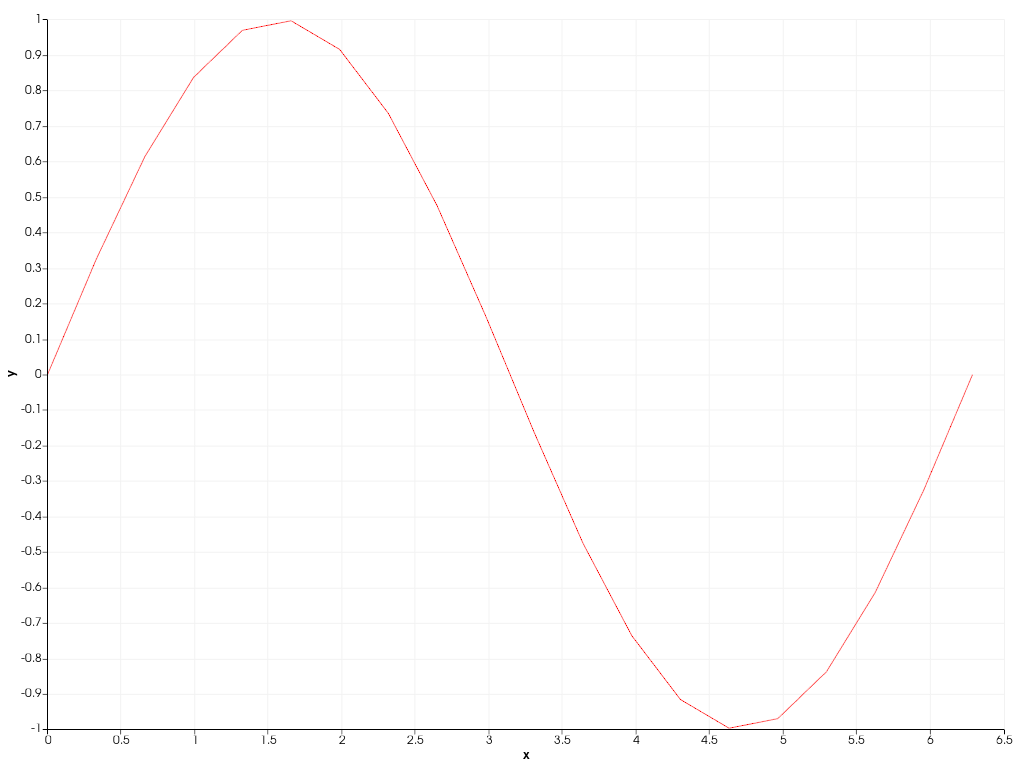
Enable the grid
>>> chart.grid = True
>>> chart.show()
Used In#
API Examples
BarPlot(1 use)
Gallery Examples