pyvista.PointSet.threshold_percent#
- PointSet.threshold_percent(
- percent: float = 0.5,
- scalars: str | None = None,
- invert: bool = False,
- continuous: bool = False,
- preference: Literal['point', 'cell'] = 'cell',
- method: Literal['upper', 'lower'] = 'upper',
- progress_bar: bool = False,
Threshold the dataset by a percentage of its range on the active scalars array.
Warning
Thresholding is inherently a cell operation, even though it can use associated point data for determining whether to keep a cell. In other words, whether or not a given point is included after thresholding depends on whether that point is part of a cell that is kept after thresholding.
- Parameters:
- percent
float| sequence[float],optional The percentage in the range
(0, 1)to threshold. If value is out of 0 to 1 range, then it will be divided by 100 and checked to be in that range.- scalars
str,optional Name of scalars to threshold on. Defaults to currently active scalars.
- invertbool, default:
False Invert the threshold results. That is, cells that would have been in the output with this option off are excluded, while cells that would have been excluded from the output are included.
- continuousbool, default:
False When True, the continuous interval [minimum cell scalar, maximum cell scalar] will be used to intersect the threshold bound, rather than the set of discrete scalar values from the vertices.
- preference
str, default: ‘cell’ When
scalarsis specified, this is the preferred array type to search for in the dataset. Must be either'point'or'cell'. Throughout PyVista, the preference is typically'point'but since the threshold filter is a cell-wise operation, we prefer cell data for thresholding operations.- method
str, default: ‘upper’ Set the threshold method for single-values, defining which threshold bounds to use. If the
valueis a range, this parameter will be ignored, extracting data between the two values. For single values,'lower'will extract data lower than thevalue.'upper'will extract data larger than thevalue.- progress_barbool, default:
False Display a progress bar to indicate progress.
- percent
- Returns:
pyvista.UnstructuredGridDataset containing geometry that meets the threshold requirements.
See also
thresholdThreshold a dataset by value.
Examples
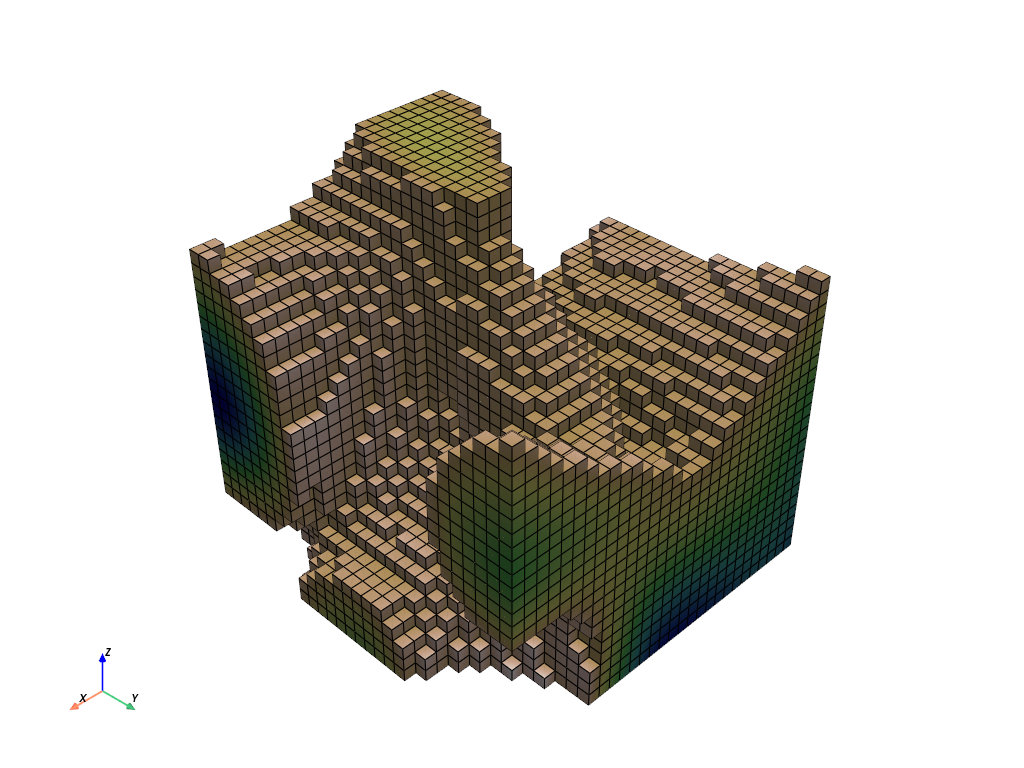
Apply a 50% threshold filter.
>>> import pyvista as pv
>>> noise = pv.perlin_noise(0.1, (2, 2, 2), (0, 0, 0))
>>> grid = pv.sample_function(
...     noise, bounds=[0, 1.0, -0, 1.0, 0, 1.0], dim=(30, 30, 30)
... )
>>> threshed = grid.threshold_percent(0.5)
>>> threshed.plot(
...     cmap='gist_earth_r',
...     show_scalar_bar=False,
...     show_edges=True,
... )

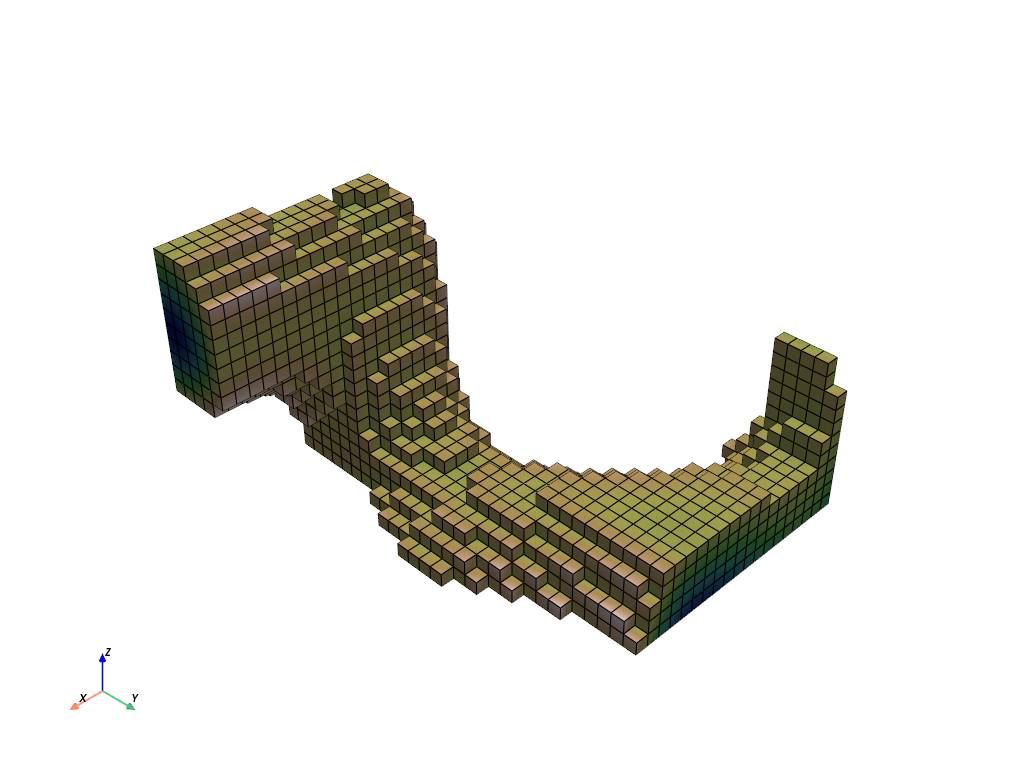
Apply a 80% threshold filter.
>>> threshed = grid.threshold_percent(0.8)
>>> threshed.plot(
...     cmap='gist_earth_r',
...     show_scalar_bar=False,
...     show_edges=True,
... )

See Using Common Filters for more examples using a similar filter.