DataSetFilters.align#
- DataSetFilters.align(
- target: DataSet | _vtk.vtkDataSet,
- max_landmarks: int = 100,
- max_mean_distance: float = 1e-05,
- max_iterations: int = 500,
- check_mean_distance: bool = True,
- start_by_matching_centroids: bool = True,
- return_matrix: bool = False,
Align a dataset to another.
Uses the iterative closest point algorithm to align the points of the two meshes. See the VTK class vtkIterativeClosestPointTransform.
- Parameters:
- target
pyvista.DataSet The target dataset to align to.
- max_landmarks
int, default: 100 The maximum number of landmarks.
- max_mean_distance
float, default: 1e-5 The maximum mean distance for convergence.
- max_iterations
int, default: 500 The maximum number of iterations.
- check_mean_distancebool, default:
True Whether to check the mean distance for convergence.
- start_by_matching_centroidsbool, default:
True Whether to start the alignment by matching centroids. Default is True.
- return_matrixbool, default:
False Return the transform matrix as well as the aligned mesh.
- target
- Returns:
- aligned
pyvista.DataSet The dataset aligned to the target mesh.
- matrix
numpy.ndarray Transform matrix to transform the input dataset to the target dataset.
- aligned
See also
align_xyzAlign a dataset to the x-y-z axes.
Examples
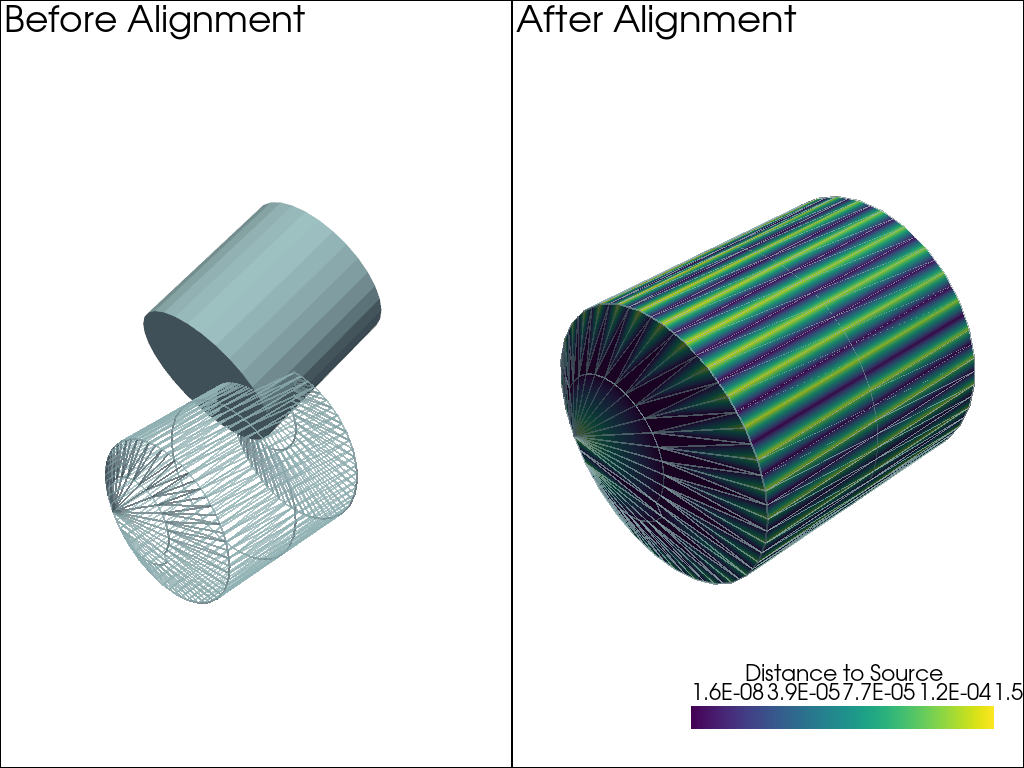
Create a cylinder, translate it, and use iterative closest point to align mesh to its original position.
>>> import pyvista as pv
>>> import numpy as np
>>> source = pv.Cylinder(resolution=30).triangulate().subdivide(1)
>>> transformed = source.rotate_y(20).translate([-0.75, -0.5, 0.5])
>>> aligned = transformed.align(source)
>>> _, closest_points = aligned.find_closest_cell(
...     source.points, return_closest_point=True
... )
>>> dist = np.linalg.norm(source.points - closest_points, axis=1)
Visualize the source, transformed, and aligned meshes.
>>> pl = pv.Plotter(shape=(1, 2))
>>> _ = pl.add_text('Before Alignment')
>>> _ = pl.add_mesh(source, style='wireframe', opacity=0.5, line_width=2)
>>> _ = pl.add_mesh(transformed)
>>> pl.subplot(0, 1)
>>> _ = pl.add_text('After Alignment')
>>> _ = pl.add_mesh(source, style='wireframe', opacity=0.5, line_width=2)
>>> _ = pl.add_mesh(
...     aligned,
...     scalars=dist,
...     scalar_bar_args={
...         'title': 'Distance to Source',
...         'fmt': '%.1E',
...     },
... )
>>> pl.show()
Show that the mean distance between the source and the target is nearly zero.
>>> np.abs(dist).mean()
9.997635192915073e-05
See Register a Surface with ICP for more examples using this filter.
