ChartBox#
- class ChartBox(*args, **kwargs)[source]#
Dedicated chart for drawing box plots.
- Parameters:
- datasequence[array_like]
Dataset(s) from which the relevant statistics will be calculated used to draw the box plot.
- colorssequence[
ColorLike],optional Color used for each drawn boxplot. If omitted (
None), the default color scheme is used.- labelssequence[
str], default: [] Label for each drawn boxplot, as shown in the chart’s legend.
- sizesequence[
float],optional Size of the chart in normalized coordinates. A size of
(0,
0)
is invisible, a size of(1, 1)occupies the whole renderer’s width and height.- locsequence[
float],optional Location of the chart (its bottom left corner) in normalized coordinates. A location of
(0, 0)corresponds to the renderer’s bottom left corner, a location of(1, 1)corresponds to the renderer’s top right corner.
Examples
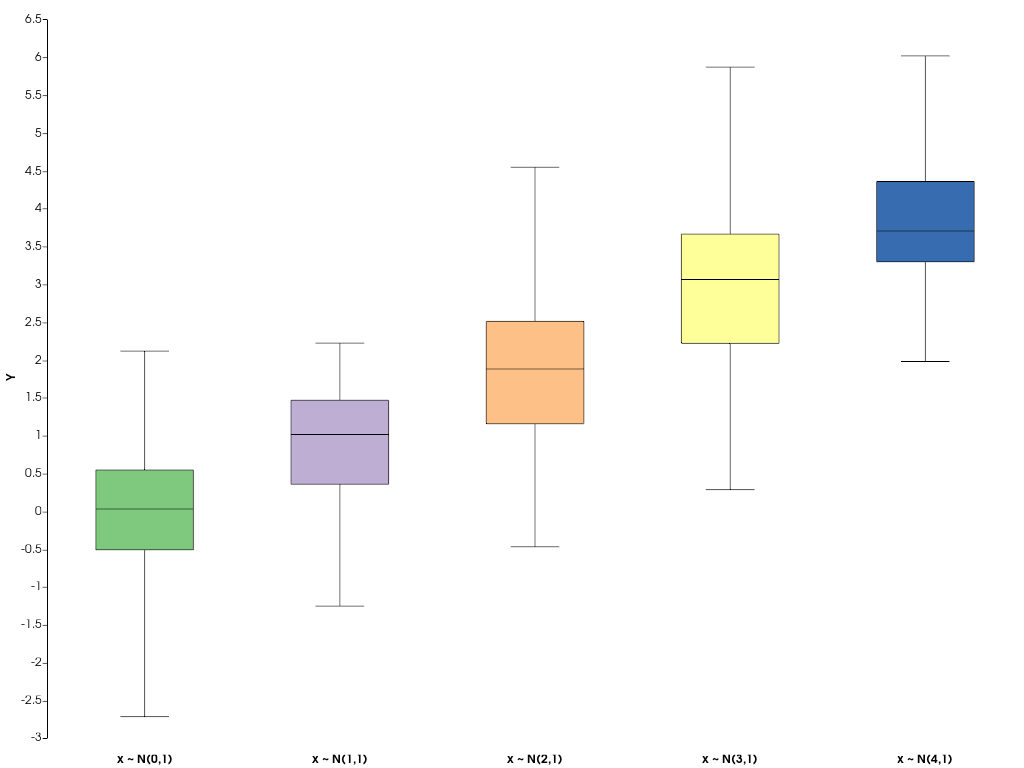
Create boxplots for datasets sampled from shifted normal distributions.
>>> import pyvista as pv
>>> import numpy as np
>>> rng = np.random.default_rng(
...     1
... )  # Seeded random number generator used for data generation
>>> normal_data = [rng.normal(i, size=50) for i in range(5)]
>>> chart = pv.ChartBox(
...     normal_data, labels=[f'x ~ N({i},1)' for i in range(5)]
... )
>>> chart.show()
Methods#
|
Show this chart in a self contained plotter. |
Toggle the chart's visibility. |
Attributes#
Return or set the chart's background color in interactive mode. |
|
Return or set the chart's border color in interactive mode. |
|
Return or set the chart's background color. |
|
Return or set the chart's background texture. |
|
Return or set the chart's border color. |
|
Return or set the chart's border style. |
|
Return or set the chart's border width. |
|
Return the chart's legend. |
|
Return or set the visibility of the chart's legend. |
|
Return or set the chart position in normalized coordinates. |
|
Return the |
|
Return or set the chart size in normalized coordinates. |
|
Return or set the chart's title. |
|
Return or set the chart's visibility. |
