Transitioning from VTK to PyVista#
VTK is primarily developed in C++ and uses chained setter and getter commands to access data. Instead, PyVista wraps the VTK data types into numpy arrays so that users can benefit from its bracket syntax and fancy indexing. This section demonstrates the difference between the two approaches in a series of examples.
For example, to hard-code points for a vtkImageData data structure using VTK Python’s bindings, one would write the following:
>>> import vtk
>>> from math import cos, sin

Create (x, y) points for a 300x300 image dataset

>>> points = vtk.vtkDoubleArray()
>>> points.SetName("points")
>>> points.SetNumberOfComponents(1)
>>> points.SetNumberOfTuples(300 * 300)

>>> for x in range(300):
...     for y in range(300):
...         points.SetValue(
...             x * 300 + y,
...             127.5 + (1.0 + sin(x / 25.0) * cos(y / 25.0)),
...         )
...

Create the image structure

>>> image_data = vtk.vtkImageData()
>>> image_data.SetOrigin(0, 0, 0)
>>> image_data.SetSpacing(1, 1, 1)
>>> image_data.SetDimensions(300, 300, 1)

Assign the points to the image

>>> image_data.GetPointData().SetScalars(points)
As you can see, there is quite a bit of boilerplate that goes into the creation of a simple vtkImageData dataset. PyVista provides much more concise syntax that is more “Pythonic.” The equivalent code in PyVista is:
>>> import pyvista as pv
>>> import numpy as np
Use the meshgrid function to create 2D "grids" of the x and y values.
This section effectively replaces the vtkDoubleArray.
>>> xi = np.arange(300)
>>> x, y = np.meshgrid(xi, xi)
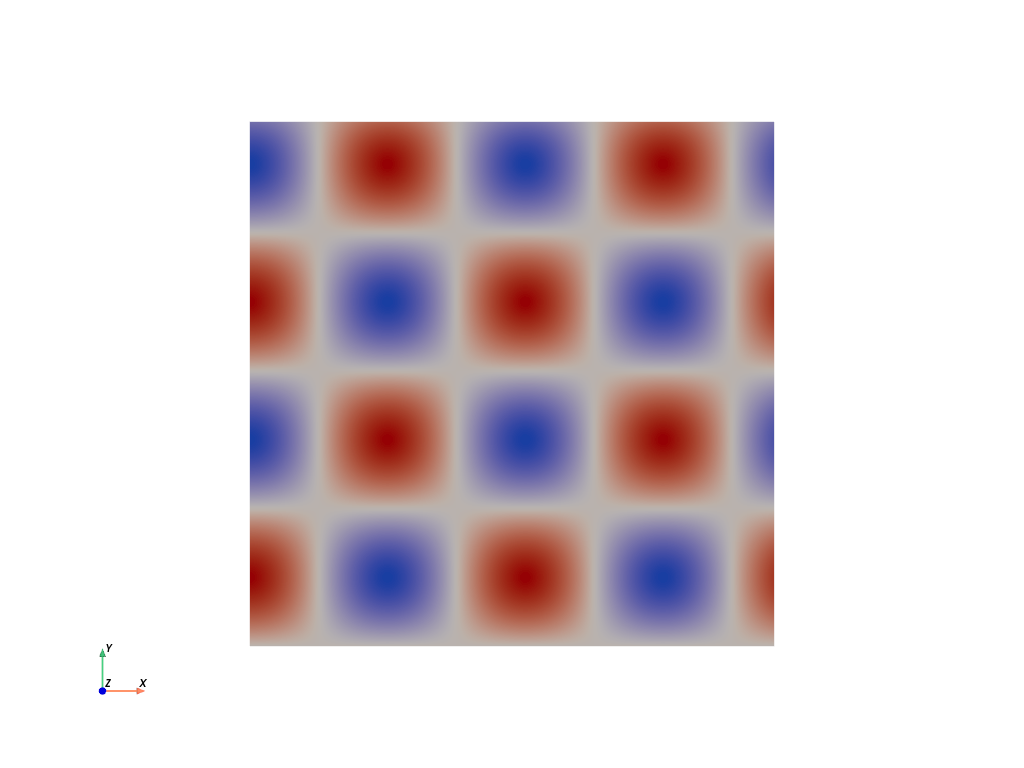
>>> values = 127.5 + (1.0 + np.sin(x / 25.0) * np.cos(y / 25.0))
Create the grid. Note how the values must use Fortran ordering.
>>> grid = pv.ImageData(dimensions=(300, 300, 1))
>>> grid.point_data["values"] = values.flatten(order="F")
Here, PyVista has done several things for us:
PyVista combines the dimensionality of the data (in the shape of the
numpy.ndarray) with the values of the data in one line. VTK uses “tuples” to describe the shape of the data (where it sits in space) and “components” to describe the type of data (1 = scalars/scalar fields, 2 = vectors/vector fields, n = tensors/tensor fields). Here, shape and values are stored concretely in one variable.pyvista.ImageDatawraps vtkImageData, just with a different name; they are both containers of evenly spaced points. Your data does not have to be an “image” to use it with vtkImageData; rather, like images, values in the dataset are evenly spaced apart like pixels in an image.Furthermore, since we know the container is for uniformly spaced data, pyvista sets the origin and spacing by default to
(0, 0, 0)and(1, 1, 1). This is another great thing about PyVista and Python. Rather than having to know everything about the VTK library up front, you can get started very easily. Once you get more familiar with it and need to do something more complex, you can dive deeper. For example, changing the origin and spacing is as simple as:>>> grid.origin = (10, 20, 10) >>> grid.spacing = (2, 3, 5)
The name for the
point_arrayis given directly in dictionary-style fashion. Also, since VTK stores data on the heap (linear segments of RAM; a C++ concept), the data must be flattened and put in Fortran ordering (which controls how multidimensional data is laid out in physically 1D memory; numpy uses “C”-style memory layout by default). This is why in our earlier example, the first argument toSetValue()was written asx*300 + y. Here, numpy takes care of this for us quite nicely and it’s made more explicit in the code, following the Python best practice of “Explicit is better than implicit.”
Finally, with PyVista, each geometry class contains methods that allow you to immediately plot the mesh without also setting up the plot. For example, in VTK you would have to do:
>>> actor = vtk.vtkImageActor()
>>> actor.GetMapper().SetInputData(image_data)
>>> ren = vtk.vtkRenderer()
>>> renWin = vtk.vtkRenderWindow()
>>> renWin.AddRenderer(ren)
>>> renWin.SetWindowName('ReadSTL')
>>> iren = vtk.vtkRenderWindowInteractor()
>>> iren.SetRenderWindow(renWin)
>>> ren.AddActor(actor)
>>> iren.Initialize()
>>> renWin.Render()
>>> iren.Start()
However, with PyVista you only need:
grid.plot(cpos='xy', show_scalar_bar=False, cmap='coolwarm')
PointSet Construction#
PyVista heavily relies on NumPy to efficiently allocate and access VTK’s C arrays. For example, to create an array of points within VTK one would normally loop through all the points of a list and supply that to a vtkPoints class. For example:
>>> import vtk
>>> vtk_array = vtk.vtkDoubleArray()
>>> vtk_array.SetNumberOfComponents(3)
>>> vtk_array.SetNumberOfValues(9)
>>> vtk_array.SetValue(0, 0)
>>> vtk_array.SetValue(1, 0)
>>> vtk_array.SetValue(2, 0)
>>> vtk_array.SetValue(3, 1)
>>> vtk_array.SetValue(4, 0)
>>> vtk_array.SetValue(5, 0)
>>> vtk_array.SetValue(6, 0.5)
>>> vtk_array.SetValue(7, 0.667)
>>> vtk_array.SetValue(8, 0)
>>> vtk_points = vtk.vtkPoints()
>>> vtk_points.SetData(vtk_array)
>>> print(vtk_points)
vtkPoints (0x55d77e475720)
  Debug: Off
  Modified Time: 92
  Reference Count: 1
  Registered Events: (none)
  Data: 0x55d77db4bef0
  Data Array Name: Points
  Number Of Points: 3
  Bounds:
    Xmin,Xmax: (0, 1)
    Ymin,Ymax: (0, 0.667)
    Zmin,Zmax: (0, 0)
To do the same within PyVista, you simply need to create a NumPy array:
>>> import numpy as np
>>> np_points = np.array([[0, 0, 0], [1, 0, 0], [0.5, 0.667, 0]])
Note
You can use pyvista.vtk_points() to construct a vtkPoints
object, but this is unnecessary in almost all situations.
Since the end goal is to construct a pyvista.DataSet, you would simply pass the
np_points array to the pyvista.PolyData constructor:
>>> import pyvista as pv
>>> poly_data = pv.PolyData(np_points)
Whereas in VTK you would have to do:
>>> vtk_poly_data = vtk.vtkPolyData()
>>> vtk_poly_data.SetPoints(vtk_points)
The same goes with assigning face or cell connectivity/topology. With
VTK you would normally have to loop using InsertNextCell and
InsertCellPoint. For example, to create a single cell
(triangle) and then assign it to vtkPolyData:
>>> cell_arr = vtk.vtkCellArray()
>>> cell_arr.InsertNextCell(3)
>>> cell_arr.InsertCellPoint(0)
>>> cell_arr.InsertCellPoint(1)
>>> cell_arr.InsertCellPoint(2)
>>> vtk_poly_data.SetPolys(cell_arr)
In PyVista, we can assign this directly in the constructor and then
access it (or change it) from the faces attribute.
>>> faces = np.array([3, 0, 1, 2])
>>> poly_data = pv.PolyData(np_points, faces)
>>> poly_data.faces
array([3, 0, 1, 2])
Object Representation#
Both VTK and PyVista provide representations for their objects.
VTK provides a verbose representation (useful for debugging) of their data types
that can be accessed via print(), as the __repr__
(unlike __str__) only provides minimal information about each object:
>>> print(vtk_poly_data)
vtkPolyData (0x55d77e9cc4c0)
  Debug: Off
  Modified Time: 6616
  Reference Count: 1
  Registered Events: (none)
  Information: 0x55d77eb18e30
  Data Released: False
  Global Release Data: Off
  UpdateTime: 0
  Field Data:
    Debug: Off
    Modified Time: 6572
    Reference Count: 1
    Registered Events: (none)
    Number Of Arrays: 0
    Number Of Components: 0
    Number Of Tuples: 0
  Number Of Points: 3
  Number Of Cells: 1
  Cell Data:
    Debug: Off
    Modified Time: 6600
    Reference Count: 1
    Registered Events:
      Registered Observers:
        vtkObserver (0x55d77ea67fe0)
          Event: 33
          EventName: ModifiedEvent
          Command: 0x55d77eb22750
          Priority: 0
          Generation: 3
          Tag: 1
    Number Of Arrays: 0
    Number Of Components: 0
    Number Of Tuples: 0
    Copy Tuple Flags: ( 1 1 1 1 1 0 1 1 1 1 1 1 )
    Interpolate Flags: ( 1 1 1 1 1 0 0 1 1 1 1 0 )
    Pass Through Flags: ( 1 1 1 1 1 1 1 1 1 1 1 1 )
    Scalars: (none)
    Vectors: (none)
    Normals: (none)
    TCoords: (none)
    Tensors: (none)
    GlobalIds: (none)
    PedigreeIds: (none)
    EdgeFlag: (none)
    Tangents: (none)
    RationalWeights: (none)
    HigherOrderDegrees: (none)
    ProcessIds: (none)
  Point Data:
    Debug: Off
    Modified Time: 6598
    Reference Count: 1
    Registered Events:
      Registered Observers:
        vtkObserver (0x55d77e9e20e0)
          Event: 33
          EventName: ModifiedEvent
          Command: 0x55d77eb22750
          Priority: 0
          Generation: 3
          Tag: 1
    Number Of Arrays: 0
    Number Of Components: 0
    Number Of Tuples: 0
    Copy Tuple Flags: ( 1 1 1 1 1 0 1 1 1 1 1 1 )
    Interpolate Flags: ( 1 1 1 1 1 0 0 1 1 1 1 0 )
    Pass Through Flags: ( 1 1 1 1 1 1 1 1 1 1 1 1 )
    Scalars: (none)
    Vectors: (none)
    Normals: (none)
    TCoords: (none)
    Tensors: (none)
    GlobalIds: (none)
    PedigreeIds: (none)
    EdgeFlag: (none)
    Tangents: (none)
    RationalWeights: (none)
    HigherOrderDegrees: (none)
    ProcessIds: (none)
  Bounds:
    Xmin,Xmax: (0, 1)
    Ymin,Ymax: (0, 0.667)
    Zmin,Zmax: (0, 0)
  Compute Time: 6698
  Editable: false
  Number Of Points: 3
  Point Coordinates: 0x55d77e475720
  PointLocator: 0
  CellLocator: 0
  Number Of Vertices: 0
  Number Of Lines: 0
  Number Of Polygons: 1
  Number Of Triangle Strips: 0
  Number Of Pieces: 1
  Piece: -1
  Ghost Level: 0
  CellsBounds:
    Xmin,Xmax: (0, 1)
    Ymin,Ymax: (0, 0.667)
    Zmin,Zmax: (0, 0)
  CellsBounds Time: 6699
PyVista chooses to show minimal data in the repr(), preferring
explicit attribute access on meshes for the bulk of attributes.
For example:
>>> poly_data
PolyData (0x7fc856b172e0)
  N Cells:    1
  N Points:   3
  N Strips:   0
  X Bounds:   0.000e+00, 1.000e+00
  Y Bounds:   0.000e+00, 6.670e-01
  Z Bounds:   0.000e+00, 0.000e+00
  N Arrays:   0
In this representation we see:
Number of cells
n_cellsNumber of points
n_pointsBounds of the mesh
boundsNumber of data arrays
n_arrays
All other attributes like lines,
point_data, or
cell_data can be
accessed directly from the object. This approach was chosen to allow
for a brief summary showing key parts of the DataSet without overwhelming the user.
Tradeoffs#
While most features can, not everything can be simplified without losing functionality or performance.
In the collision filter,
we demonstrate how to calculate the collision between two meshes. For
example:
import pyvista as pv

# create a default sphere and a shifted sphere
mesh_a = pv.Sphere()
mesh_b = pv.Sphere(center=(-0.4, 0, 0))
out, n_coll = mesh_a.collision(mesh_b, generate_scalars=True, contact_mode=2)

pl = pv.Plotter()
pl.add_mesh(out)
pl.add_mesh(mesh_b, style='wireframe', color='k')
pl.camera_position = 'xy'
pl.show()
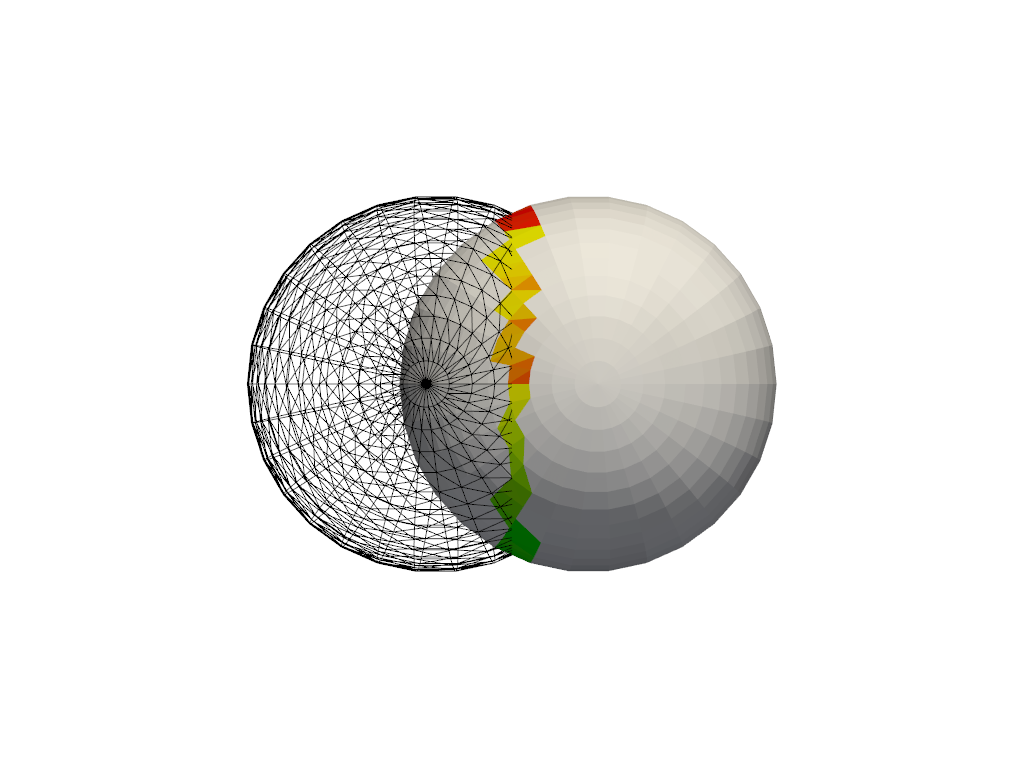
Under the hood, the collision filter detects mesh collisions using oriented bounding box (OBB) trees. For a single collision, this filter is as performant as the VTK counterpart, but when computing multiple collisions with the same meshes, as in the Collision example, it is more efficient to use the vtkCollisionDetectionFilter, as the OBB tree is computed once for each mesh. In most cases, pure PyVista is sufficient for most data science, but there are times when you may want to use VTK classes directly.
Note that nothing stops you from using VTK classes and then wrapping the output with PyVista. For example:
import vtk
import pyvista as pv

# Create a circle using vtk
polygonSource = vtk.vtkRegularPolygonSource()
polygonSource.GeneratePolygonOff()
polygonSource.SetNumberOfSides(50)
polygonSource.SetRadius(5.0)
polygonSource.SetCenter(0.0, 0.0, 0.0)
polygonSource.Update()

# wrap and plot using pyvista
mesh = pv.wrap(polygonSource.GetOutput())
mesh.plot(line_width=3, cpos='xy', color='k')
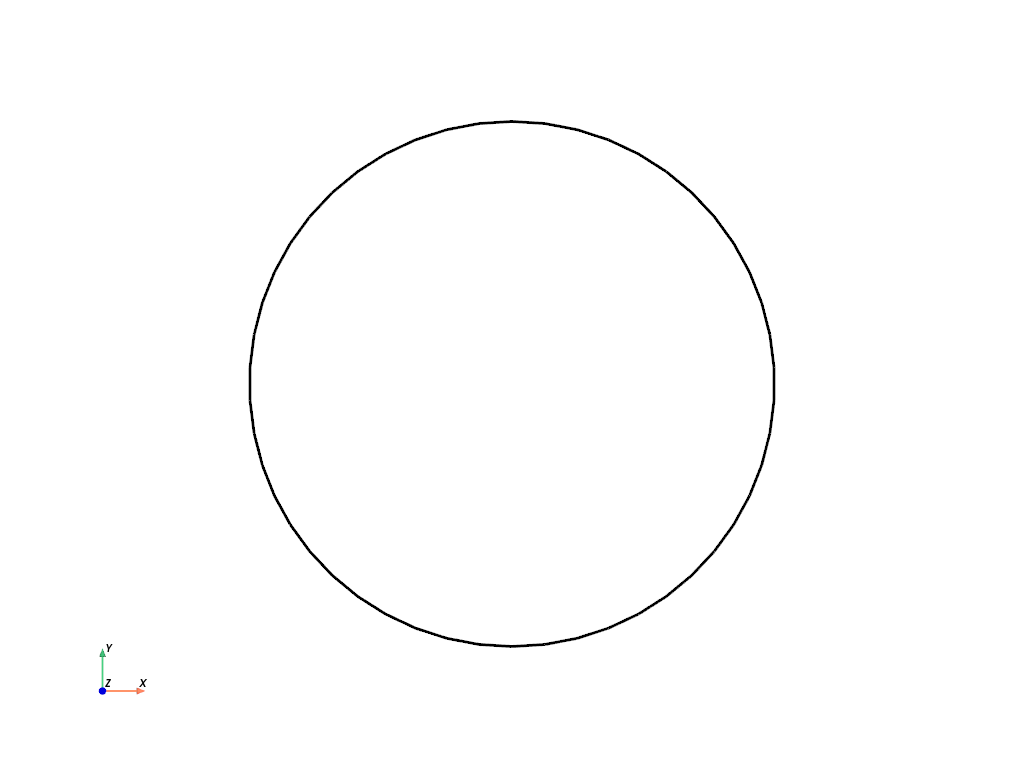
In this manner, you can get the “best of both worlds” should you need the flexibility of PyVista and the raw power of VTK.
Note
You can use pyvista.Polygon() for a one line replacement of
the above VTK code.
