Basic API Usage#
PyVista provides tools to get started with just about any VTK dataset
and wrap that object into an easily accessible data object.
Whether you are new to the VTK library or a power user, the best place to
get started is with PyVista’s pyvista.wrap() and pyvista.read()
functions to either wrap a VTK data object in memory or read a VTK or
VTK-friendly file format.
Wrapping a VTK Data Object#
The wrapping function pyvista.wrap() is usable from the top level of
PyVista. This allows users to quickly wrap any VTK dataset they have as a
PyVista object:
import vtk
import pyvista as pv

stuff = vtk.vtkPolyData()
better = pv.wrap(stuff)
Reading a VTK File#
PyVista provides a convenience function to read VTK file formats into their
respective PyVista data objects. Simply call the pyvista.read() function
passing the filename:
import pyvista as pv

mesh = pv.read('my_strange_vtk_file.vtk')
Accessing the Wrapped Data Object#
Now that you have a wrapped VTK data object, you can start accessing and modifying the dataset. Some of the most common properties to access include the points and point/cell data (the data attributes assigned to the nodes or cells of the mesh respectively).
First, check out some common meta-properties:
>>> import pyvista as pv
>>> from pyvista import examples
>>> import numpy as np
>>> mesh = examples.load_airplane()

Inspect how many cells are in this mesh

>>> mesh.n_cells
2452

Inspect how many points are in this mesh
>>> mesh.n_points
1335

What about scalar arrays? Are there any?

>>> mesh.n_arrays
0

What are the mesh bounds?
>>> mesh.bounds
BoundsTuple(x_min =  139.06100463867188,
            x_max = 1654.9300537109375,
            y_min =   32.09429931640625,
            y_max = 1319.949951171875,
            z_min =  -17.741199493408203,
            z_max =  282.1300048828125)

Where is the center of this mesh?

>>> mesh.center
(897.0, 676.02, 132.19)
Access the points by fetching the points attribute on any PyVista mesh
as a numpy.ndarray:
>>> the_pts = mesh.points
>>> isinstance(the_pts, np.ndarray)
True

>>> the_pts[0:5, :]
array([[896.994 ,  48.7601,  82.2656],
       [906.593 ,  48.7601,  80.7452],
       [907.539 ,  55.4902,  83.6581],
       [896.994 ,  55.4902,  85.3283],
       [896.994 ,  42.8477,  77.825 ]], dtype=float32)
Accessing the different data attributes on the nodes and cells of the mesh is interfaced via dictionaries with callbacks to the VTK object. These dictionaries of the different point and cell arrays can be directly accessed and modified as NumPy arrays. In the example below, we load a dataset, access an array on that dataset, then add some more data:
>>> mesh = examples.load_uniform()

Fetch a data array from the point data dictionary

>>> arr = mesh.point_data['Spatial Point Data']

Assign a new array to the cell data:

>>> mesh.cell_data['foo'] = np.random.rand(mesh.n_cells)

Don't remember if your array is point or cell data? You can
directly query the mesh object and access the array from the
dataset.

>>> foo = mesh['foo']
>>> isinstance(foo, np.ndarray)
True

Or maybe you just want to add an array where it fits.

>>> mesh['new-array'] = np.random.rand(mesh.n_points)
Plotting#
PyVista includes numerous plotting routines that are intended to be intuitive
and highly controllable with matplotlib similar syntax and keyword
arguments.
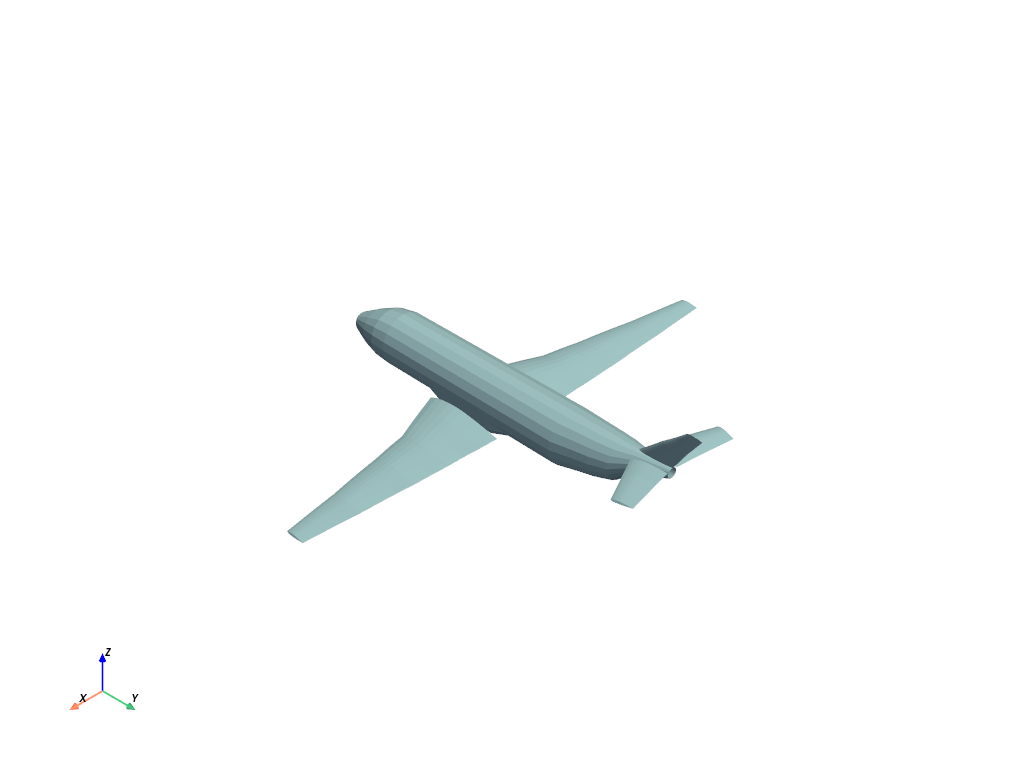
To get started, try out the pyvista.plot() convenience method
that is bound to each PyVista data object.
import pyvista as pv
from pyvista import examples

mesh = examples.load_airplane()
mesh.plot()
You can also create a plotter object to fine tune the scene. First,
instantiate a plotter such as pyvista.Plotter or
pyvistaqt.BackgroundPlotter. The pyvista.Plotter
will create a rendering window that will pause the execution of the
code after calling show().
mesh = examples.load_airplane()

pl = pv.Plotter()    # instantiate the plotter
pl.add_mesh(mesh)    # add a mesh to the scene
pl.camera.zoom(2)    # Note how we can now access underlying attributes
pl.show()            # show the rendering window
Optionally show() can return
the last used camera position of the rendering window in case you want
to choose a camera position and use it again later. The camera
position is also available as the camera_position attribute of the plotter (even
after it’s closed).
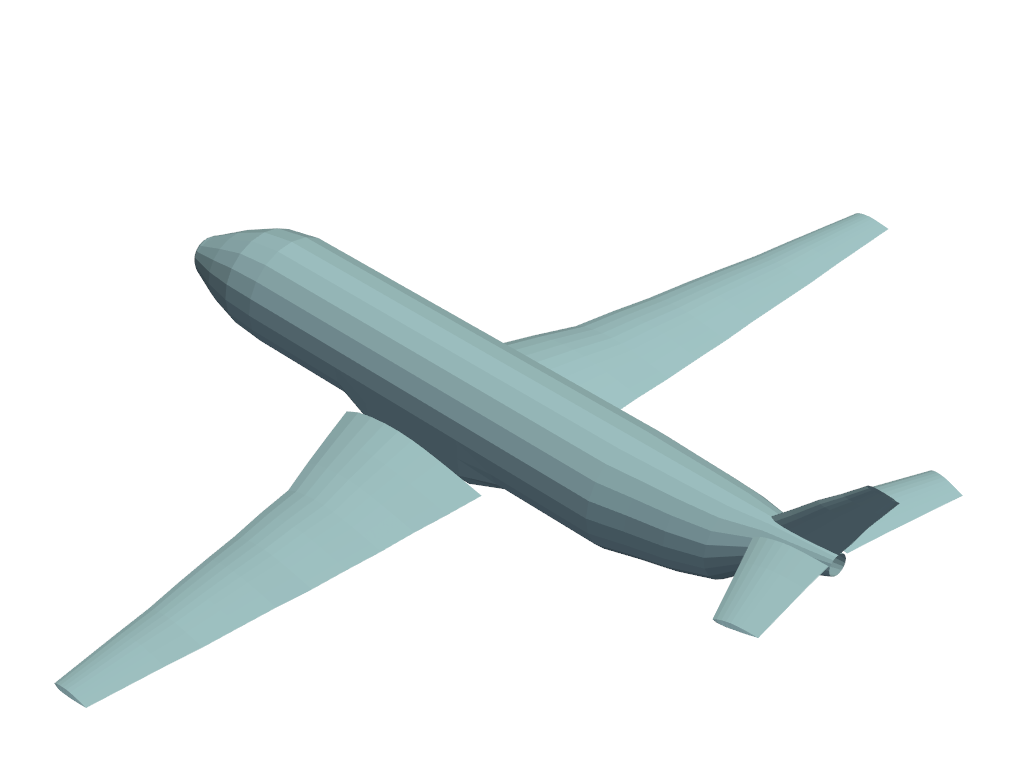
You can then use this cached camera position for additional plotting without having to manually interact with the plotting window:
# reuse the camera position from the previous plotter
cpos = pl.camera_position
pl = pv.Plotter(off_screen=True)
pl.add_mesh(mesh, color='lightblue')
pl.camera_position = cpos
pl.show(screenshot='airplane.png')
Be sure to check out all the available plotters and their options for your use case:
pyvista.Plotter: The standard plotter that pauses the code until closed.pyvistaqt.BackgroundPlotter: Creates a rendering window that is interactive and does not pause the code execution (for more information see the pyvistaqt library)
Command Line#
Starting from version 0.47, meshes can be plotted from one (or more)
files using a command line tool such that:
pyvista plot <files> [OPTIONS]
python -m pyvista plot <files> [OPTIONS]
Note
Providing multiple files renders them inside the same window.
Most options available in pyvista.plot() are exposed by the command line.
Run the --help command to see all options:
pyvista plot --help
python -m pyvista plot --help
Exporting#
Any PyVista mesh object can be saved to a VTK file format using
save(). For example, the mesh in the
code block above could be saved like:
mesh.save("mesh.vtk")
Or since that mesh is pyvista.PolyData, we could use the .vtp,
.stl, or .ply formats as well.
For more details on which formats are supported in the .save() method,
please refer to the docs for that method on each mesh type.
Also note that we can export any PyVista mesh to any file format supported by meshio. Meshio supports many formats including: Abaqus, Ansys msh, AVS-UCD, CGNS, DOLFIN XML, Exodus, FLAC3D, H5M, Kratos/MDPA, Medit, MED/Salome, Gmsh (versions 2 and 4), OBJ, OFF, PERMAS, PLY, STL, TetGen .node/.ele, SVG (2D only, output only), UGRID, WKT (TIN), XDMF, and more.
To save a PyVista mesh using meshio, use pyvista.save_meshio():
pv.save_meshio("mesh.obj", mesh)
