Note
Go to the end to download the full example code.
Visible Vertices#
Display vertices on a mesh in the same fashion as edge visibility.
import pyvista as pv
from pyvista import examples

mesh = examples.download_bunny_coarse()

cpos = pv.CameraPosition(
    position=(0.036, 0.367, 0.884),
    focal_point=(0.024, 0.033, -0.022),
    viewup=(-0.303, 0.895, -0.325),
)
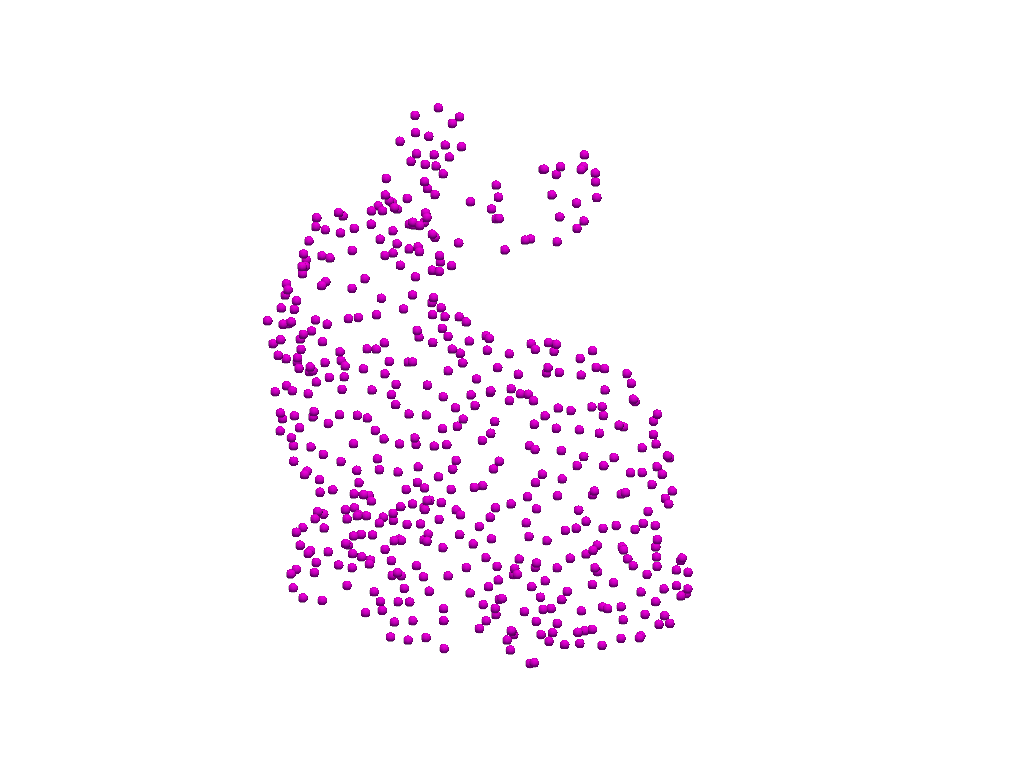
We can easily display all vertices of a mesh with a points style
representation when plotting:
pl = pv.Plotter()
pl.add_mesh(
    mesh, style='points', color='magenta', render_points_as_spheres=True, point_size=10
)
pl.show(cpos=cpos)
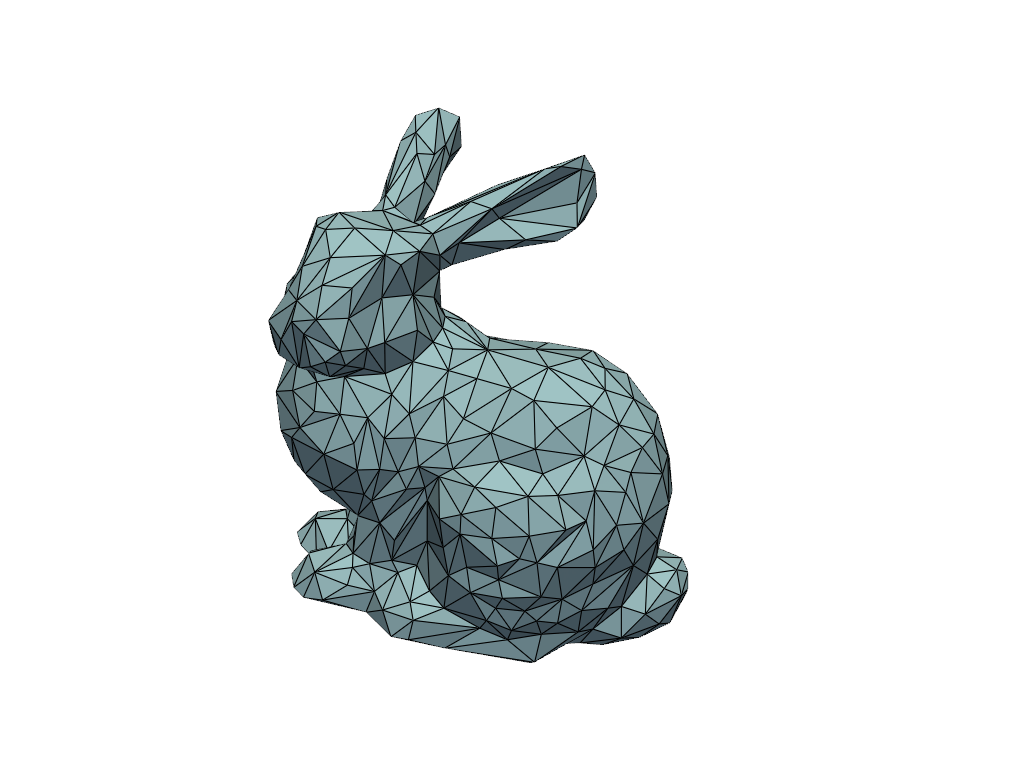
However, we often want to see the vertices of a mesh rendered atop the surface geometry. Much like how we can render the edges of a mesh:
pl = pv.Plotter()
pl.add_mesh(mesh, show_edges=True)
pl.show(cpos=cpos)
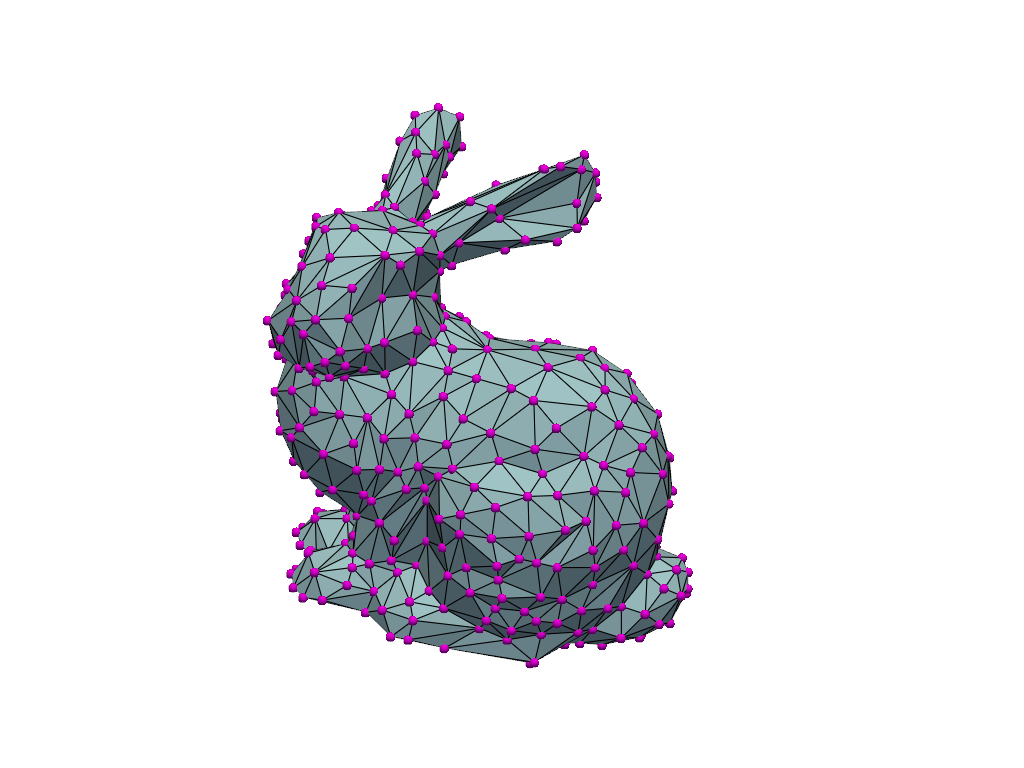
In order to display the vertices atop a mesh’s surface geometry, simply pass
show_vertices=True to render them along side the original geometry.
Note
Vertex styling can be changed using vertex_color, vertex_opacity,
and vertex_style.
pl = pv.Plotter()
pl.add_mesh(
    mesh,
    show_edges=True,
    vertex_color='magenta',
    render_points_as_spheres=True,
    point_size=10,
    show_vertices=True,
)
pl.show(cpos=cpos)
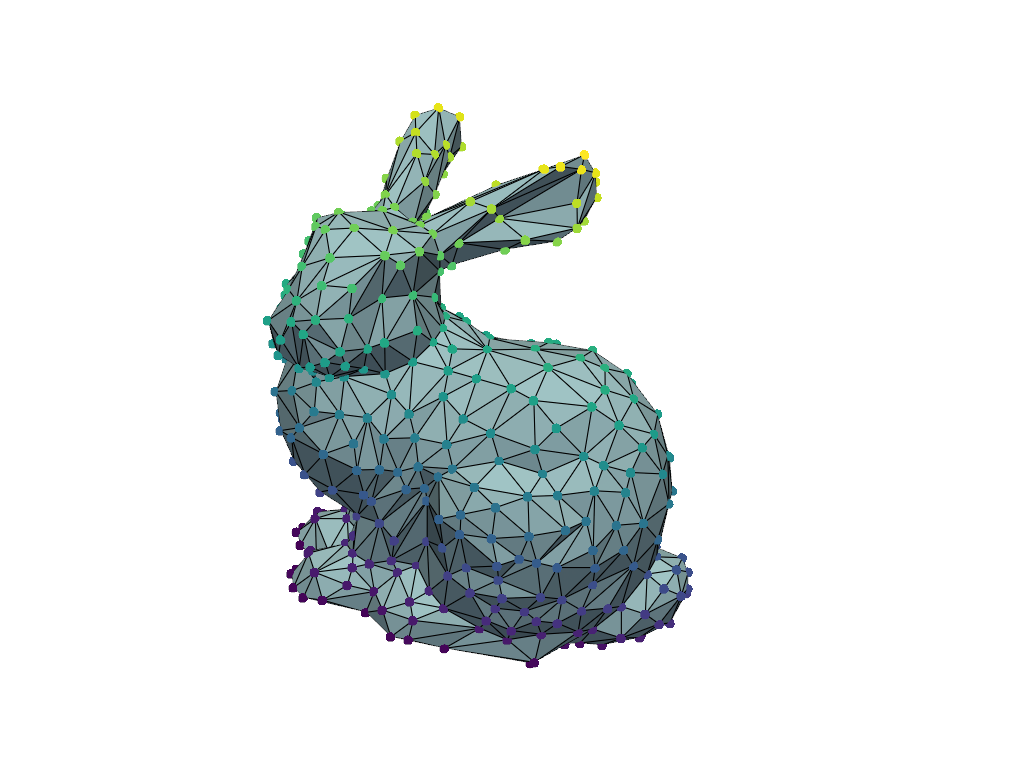
If you wish to have further control over the way surface points are plotted alongside the surface geometry, extract the surface points and plot them separately.
The first step is to extract the outer surface geometry of the mesh then grab all the points of that extraction.
surf_points = mesh.extract_surface(algorithm=None).points
Now that we have the vertices extracted, we can use add_points() to render them along side the original
geometry.
Color the points by their Y position.
pl = pv.Plotter()
pl.add_mesh(mesh, show_edges=True)
pl.add_points(
    surf_points,
    color='magenta',
    render_points_as_spheres=True,
    point_size=10,
    scalars=surf_points[:, 1],
    lighting=False,
    show_scalar_bar=False,
)
pl.show(cpos=cpos)
Total running time of the script: (0 minutes 0.940 seconds)
