Note
Go to the end to download the full example code.
Silhouette Highlight#
Extract a subset of the edges of a polygonal mesh to generate an outline
(silhouette) of a mesh.
The silhouette may be created using the silhouette keyword with
add_mesh(), or by using
~pyvista.Plotter.add_silhouette directly.
import pyvista as pv
from pyvista import examples
Prepare a triangulated PolyData
bunny = examples.download_bunny()
Now we can display the silhouette of the mesh and compare the result:
pl = pv.Plotter(shape=(1, 2))
pl.subplot(0, 0)
pl.add_mesh(bunny, color='lightblue', silhouette=True)
pl.add_text('Silhouette')
pl.view_xy()
pl.subplot(0, 1)
pl.add_mesh(bunny, color='lightblue')
pl.add_text('No silhouette')
pl.view_xy()
pl.show()
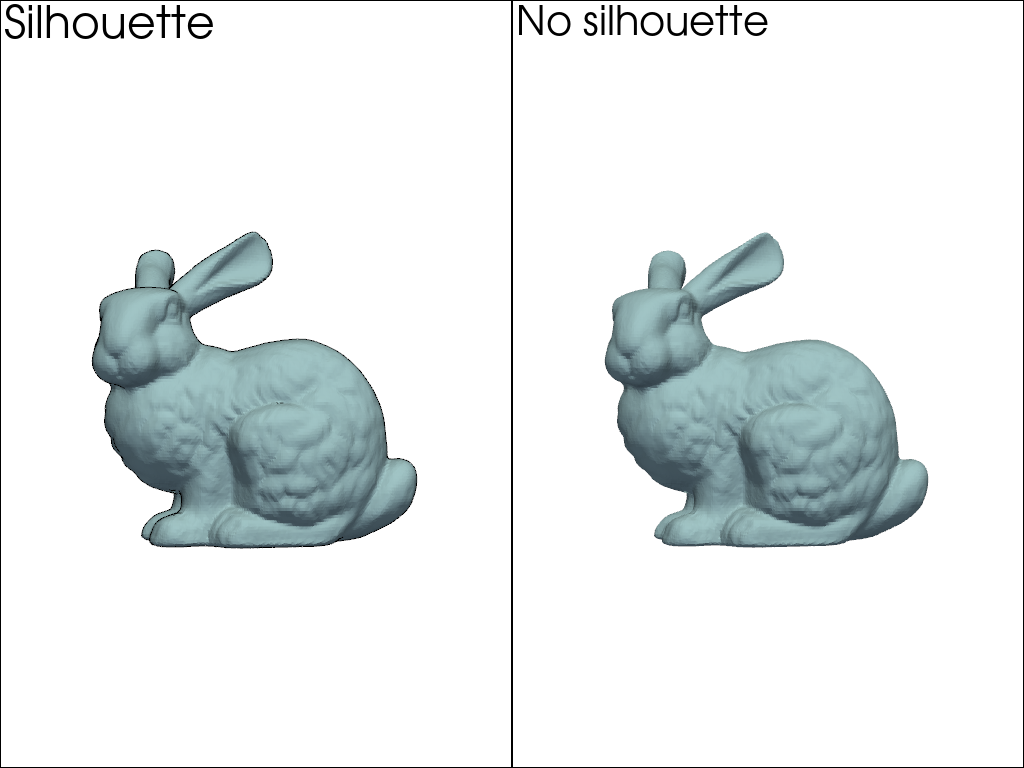
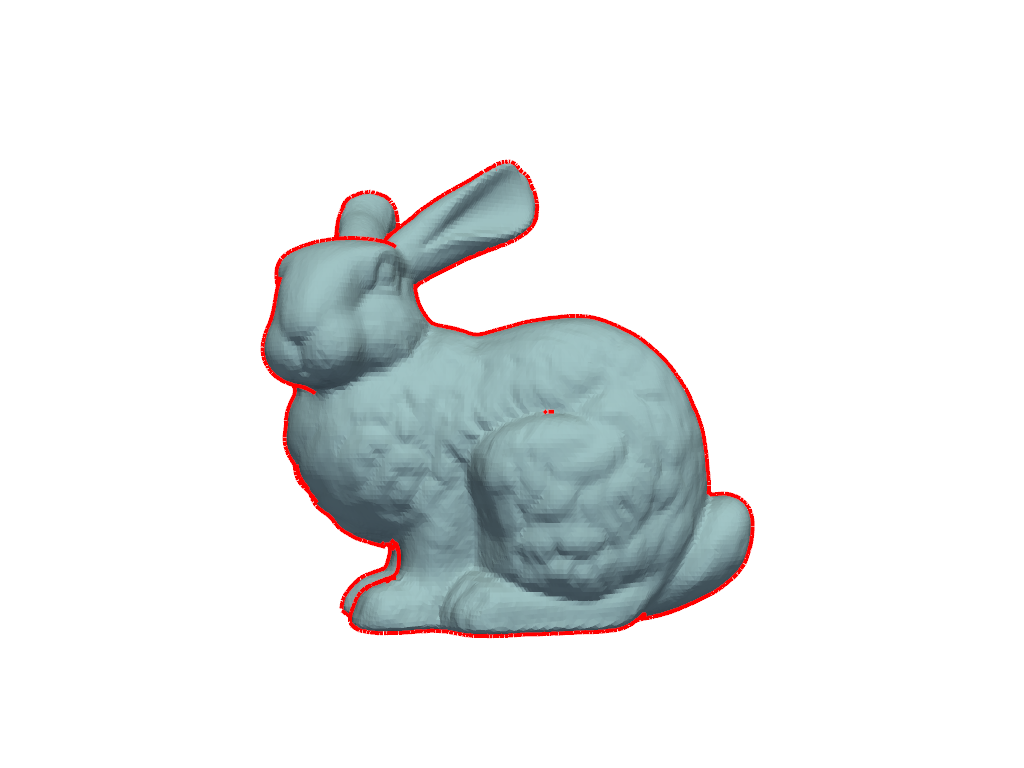
Maybe the default parameters are not enough to really notice the silhouette.
But by using a dict, it is possible to modify the properties of the
outline. For example, color and width could be specified like so:
pl = pv.Plotter()
silhouette = dict(
    color='red',
    line_width=8.0,
)
pl.add_mesh(bunny, silhouette=silhouette)
pl.view_xy()
pl.show()
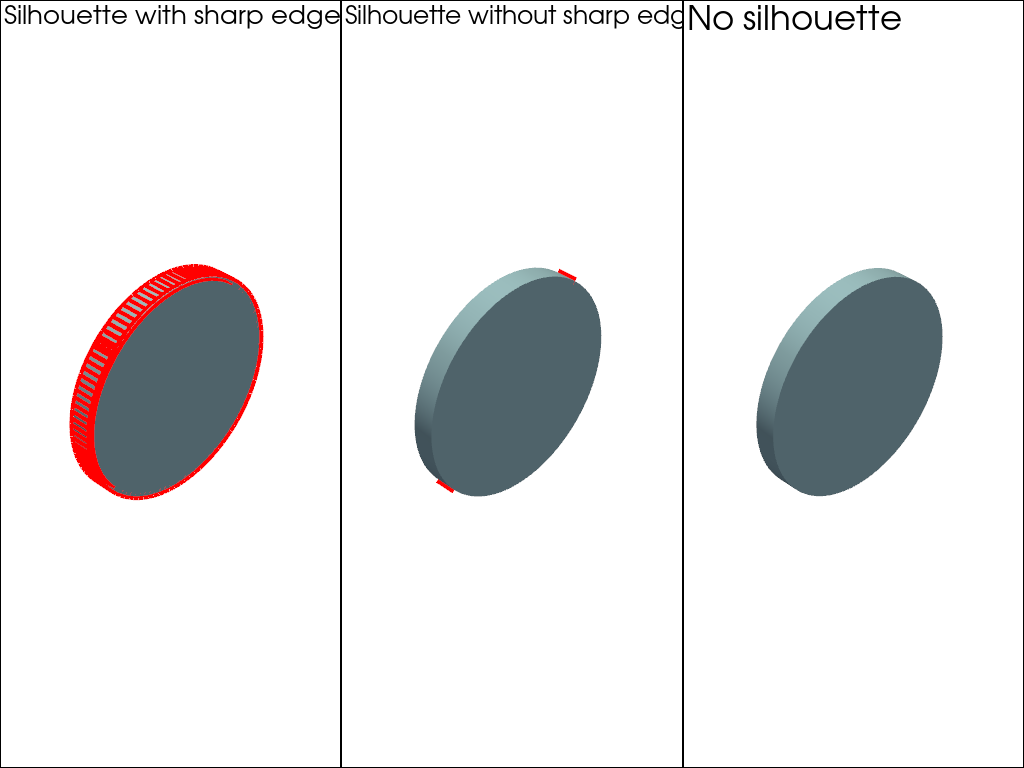
By default, PyVista uses a pretty aggressive decimation level but we might want to disable it. It is also possible to display sharp edges:
cylinder = pv.Cylinder(
    center=(0, 0.04, 0),
    direction=(0, 1, 0),
    radius=0.15,
    height=0.03,
).triangulate()

pl = pv.Plotter(shape=(1, 3))
pl.subplot(0, 0)
pl.add_mesh(
    cylinder,
    color='lightblue',
    smooth_shading=True,
    silhouette=dict(color='red', line_width=8.0, decimate=None, feature_angle=True),
)
pl.add_text('Silhouette with sharp edges')
pl.view_isometric()
pl.subplot(0, 1)
pl.add_mesh(
    cylinder,
    color='lightblue',
    smooth_shading=True,
    silhouette=dict(color='red', line_width=8.0, decimate=None),
)
pl.add_text('Silhouette without sharp edges')
pl.view_isometric()
pl.subplot(0, 2)
pl.add_mesh(cylinder, color='lightblue', smooth_shading=True)
pl.add_text('No silhouette')
pl.view_isometric()
pl.show()
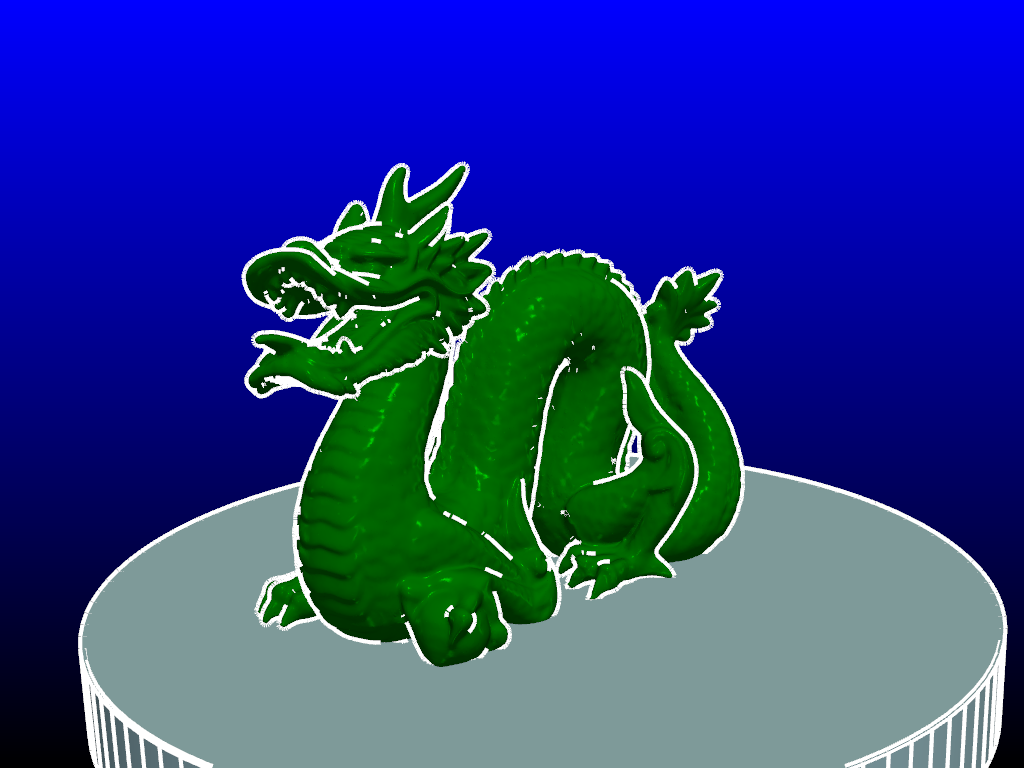
Here is another example:
dragon = examples.download_dragon()
pl = pv.Plotter()
pl.set_background('black', top='blue')
pl.add_mesh(
    dragon,
    color='green',
    specular=1,
    smooth_shading=True,
    silhouette=dict(line_width=8, color='white'),
)

pl.add_mesh(
    cylinder,
    color='lightblue',
    smooth_shading=True,
    silhouette=dict(decimate=None, feature_angle=True, line_width=8, color='white'),
)
pl.camera_position = pv.CameraPosition(
    position=(-0.2936731887752889, 0.2389060430625446, 0.35138839367034236),
    focal_point=(-0.005878899246454239, 0.12495124898850918, -0.004603400826454163),
    viewup=(0.34348225747312017, 0.8567703221182346, -0.38466160965007384),
)
pl.show()
Total running time of the script: (0 minutes 11.860 seconds)
