Plotting#
When plotting with the interactive rendering windows in VTK, several keyboard shortcuts are available:
Key |
Action |
|
|---|---|---|
Linux/Windows |
Mac |
|
|
Close the rendering window |
|
|
Focus and zoom in on a point |
|
|
Isometric camera view |
|
|
Switch all datasets to a |
|
|
Reset the camera to view all datasets |
|
|
Switch all datasets to a |
|
|
|
Pan the rendering scene |
|
|
Rotate the rendering scene in 3D |
|
Rotate the rendering scene in 2D (view-plane) |
|
|
|
Continuously zoom the rendering scene |
|
Save a screenshot (only on |
|
|
Enable interactive cell selection/picking |
|
|
Zoom in and out |
|
|
Increase/decrease the point size and line widths |
|
Plotting in a Jupyter Notebook#
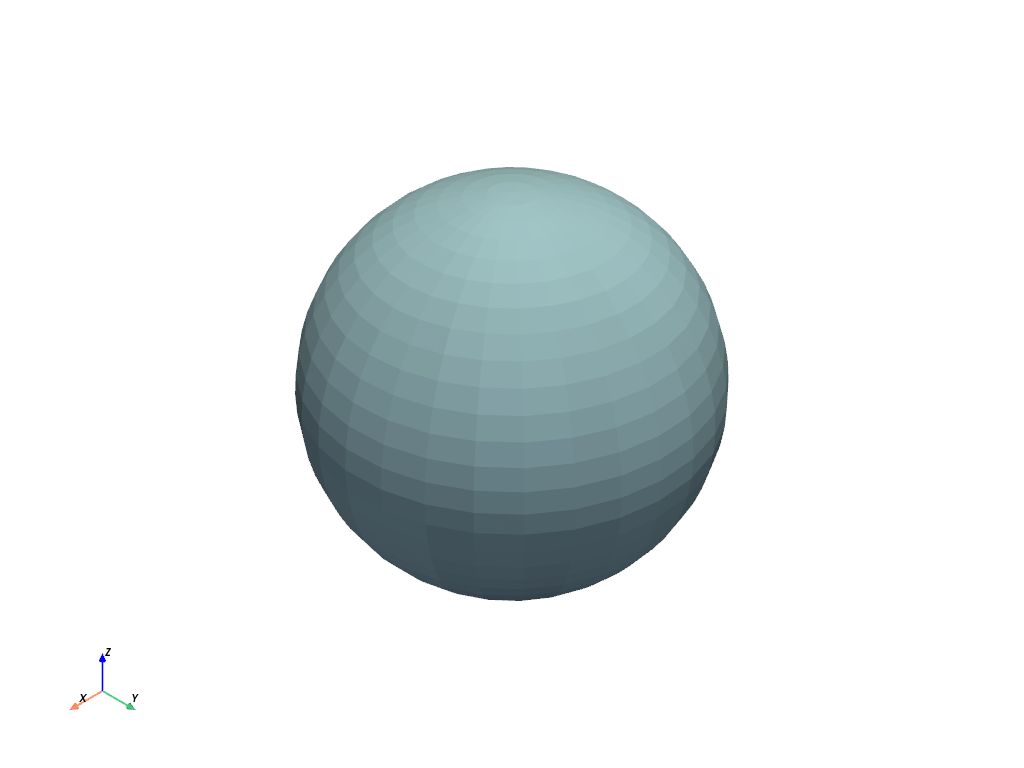
Static and interactive inline plots are possible using a Jupyter notebook. The code snippet below will create a static screenshot of the rendering and display it in the Jupyter notebook:
import pyvista as pv
sphere = pv.Sphere()
sphere.plot(jupyter_backend='static')
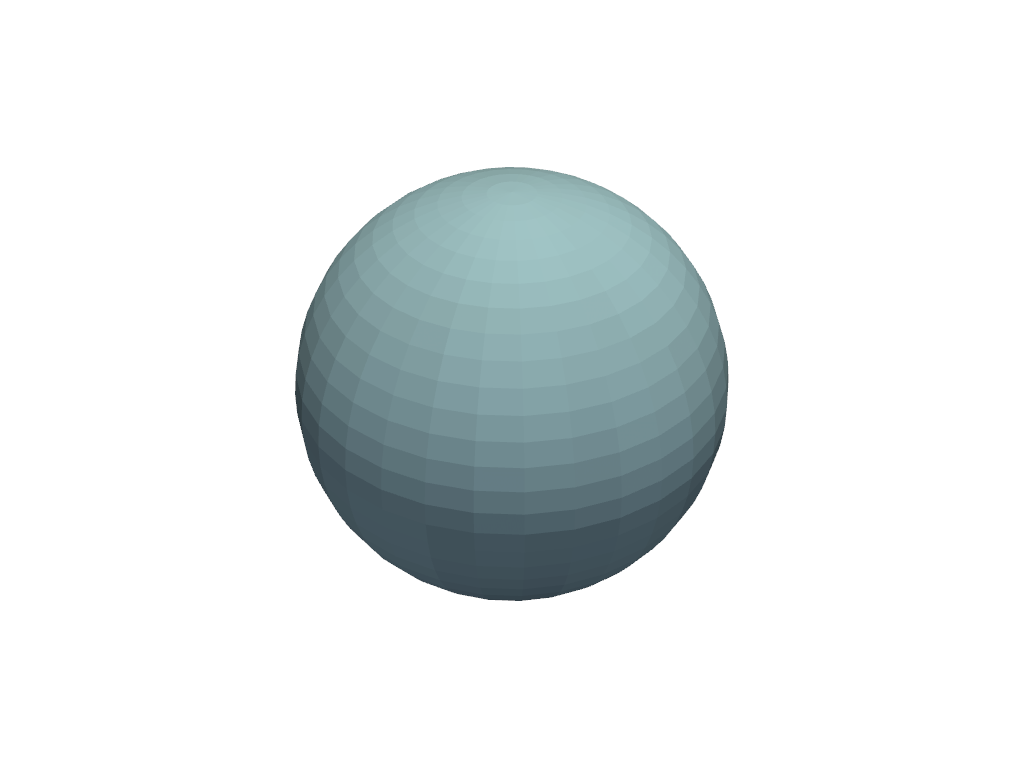
It is possible to use the Plotter class as well.
pl = pv.Plotter(notebook=True)
pl.add_mesh(sphere)
pl.show(jupyter_backend='static')
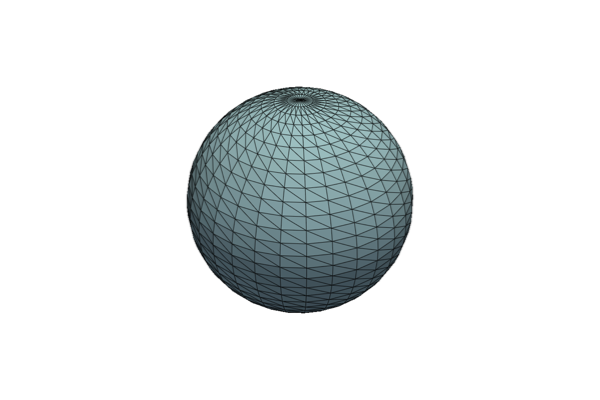
Additionally, you can generate interactive plots by leveraging our
jupyter plotting backend trame. You can even use it to create
interactive documentation online.
pl = pv.Plotter(window_size=(600, 400))
pl.background_color = 'w'
pl.enable_anti_aliasing()
pl.add_mesh(sphere, color='lightblue', show_edges=True)
pl.show(jupyter_backend='static')
For more details, see the section on Jupyter Notebook Plotting.
Background Plotting#
PyVista provides a plotter that enables users to create a rendering
window in the background that remains interactive while the user
performs their processing. This creates the ability to make a
rendering scene and interactively add or remove datasets from the
scene as well as has some useful menu functions for common scene
manipulation or export tasks. To get started, try instantiating the
pyvistaqt.BackgroundPlotter:
import pyvista as pv
import pyvistaqt as pvqt
from pyvista import examples

dataset = examples.load_hexbeam()

p = pvqt.BackgroundPlotter()
p.add_mesh(dataset)
p.show_bounds(grid=True, location='back')
Plot Time Series Data#
This example outlines how to plot data where the spatial reference and data values change through time:
from threading import Thread
import time
import numpy as np
import pyvista as pv
import pyvistaqt as pvqt
from pyvista import examples

globe = examples.load_globe()
texture = examples.load_globe_texture()
globe.point_data['scalars'] = np.random.rand(globe.n_points)
globe.set_active_scalars('scalars')


pl = pvqt.BackgroundPlotter()
pl.add_mesh(
    globe,
    lighting=False,
    show_edges=True,
    texture=texture,
    scalars='scalars',
)
pl.view_isometric()


# shrink globe in the background
def shrink():
    for i in range(50):
        globe.points *= 0.95
        # Update scalars
        globe.point_data['scalars'] = np.random.rand(globe.n_points)
        time.sleep(0.5)


thread = Thread(target=shrink)
thread.start()