BarPlot.y#
Examples#
Download Python source code | Download Jupyter notebook
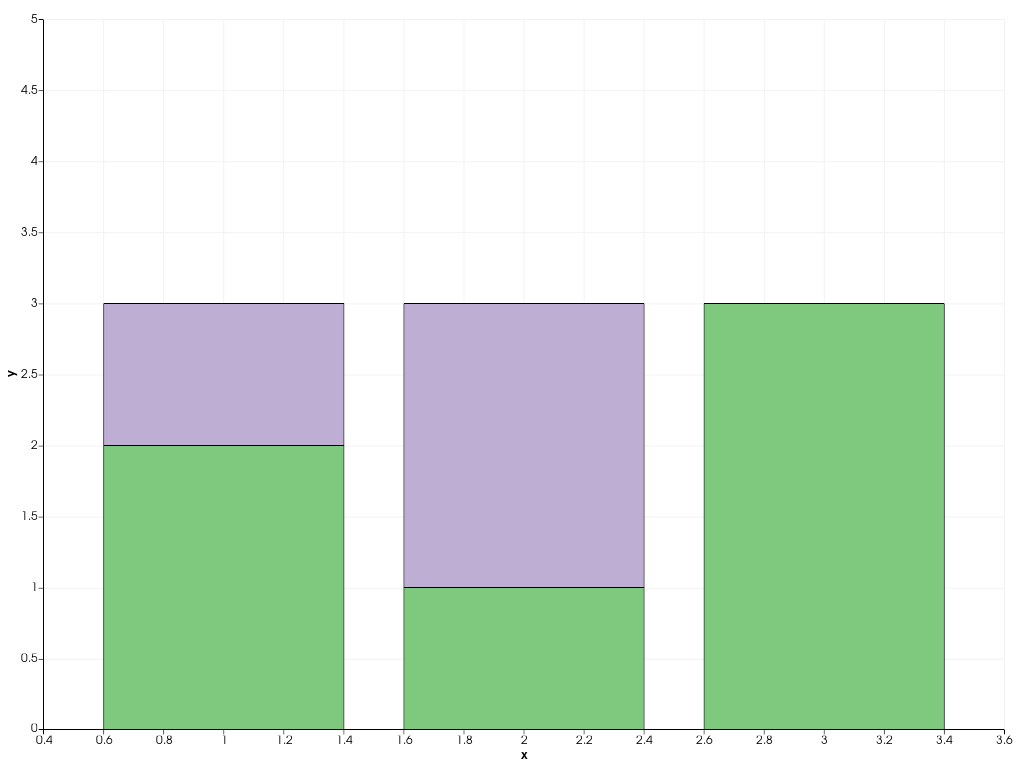
Create a bar plot and display the sizes.
>>> import pyvista as pv
>>> chart = pv.Chart2D()
>>> plot = chart.bar([1, 2, 3], [[2, 1, 3], [1, 2, 0]])
>>> plot.y
(pyvista_ndarray([2, 1, 3]), pyvista_ndarray([1, 2, 0]))
>>> chart.show()